Would you believe the utilities stocks are the most consistent performers over the last six months? It's true. The average utility stock is up by 6.5% since mid-January. That's not the absolute leader of total returns since then. Energy (+10.3%) and materials (+13.8%) have the best longer-term track records. The industrials are right behind them, with a six-month gain of 7.2%. Right after that, though, are the utilities. And just for the record, only half of the ten major sectors have made any kind of real gain in the last six months.
So why are we highlighting a slightly bullish/mediocre sector? What the utilities stocks lack in rally potential, they more than make up for in consistency. In other words, although they'll never offer the kind of rewards a tech stock or biotech company could, at least they are dependable and predictable. With the exception of the one-month timeframe, utilities have remained in the top half of sector performance rankings all year long. Only materials and energy stocks have managed to do the same. However, those two sectors include a lot of risk, since they're treated as a hedge, and are inflation sensitive. The utilities don't have that particular problem.
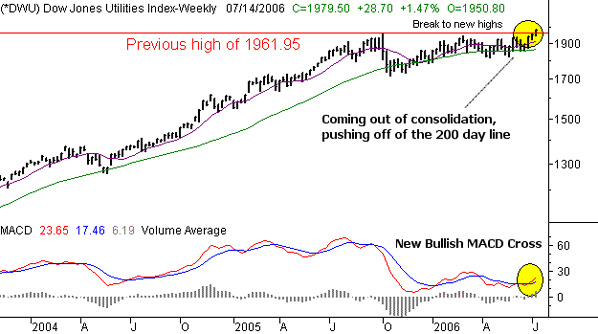
The question is, though, does the utilities chart justify an entry point now? Or, is the sector just likely to stay stuck in the middle of the pack? While we like the consistency with which the utility names have walked higher, our chart of the Dow Jones Utilities Average (DJU) does indeed suggest that now is a good spot to enter. We have new buy signals, and the price chart itself suggests that a breakout move may be in the foundational stages.
The sector went through a consolidation phase in the first half of 2006, taking a much-deserved break from a heroic 2004 and 2005. However, the recent move to 1979.50 pushed the Dow Jones Utilities Index to new 52-week highs. The move was made when the index managed to push off of the 200 day line (green), which had been support during the entire consolidation period. The combination of all those factors suggests that utilities stocks may surprise a lot of investors and resume its bullishness from a couple of years ago. We'll set a longer-term target for the Dow Jones Utility Average at 2330, with a stop of any close under the 200 day average. Currently, the 200 day line is at 1863, but rises slightly each day.
Dow Jones Utility Average (DJU) - Weekly

Price Headley is the founder and chief analyst of BigTrends.com.