When considering confirming forecasting indicators, price is by far the most important, but it is followed closely by volume, which applies in all markets. Then, next in line is open interest, which is used primarily in the futures market. These can be used to help with stock trading and options trading.
Volume is defined as the number of entities being traded during the time period under study. It can be daily or weekly, but is not plotted on a monthly basis.
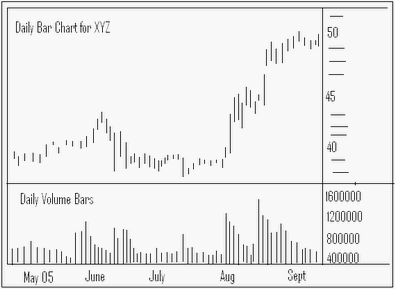
Daily volume is plotted by a vertical bar at the bottom of the chart below the day's price action. Whereas, weekly volume is the total for the whole week and is plotted under the weekly price action. See the daily bar chart example below as shown in a bullish uptrend.

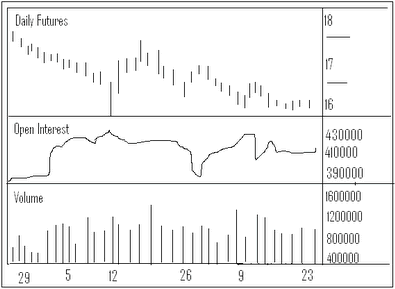
Open interest in futures represents the total number of outstanding longs or shorts in the market -- NOT the sum of both. The number of outstanding or unliquidated contracts at the end of the day is open interest. It's the solid line plotted on a chart in the area found between the price data (top of the chart) and the volume (bottom of the chart). It is important to remember that open interest and volume are reported one day late in the futures market. Open interest is the number of contracts. A contract is created when there are two market participants - a buyer and a seller. Each day the open interest is reported using either a positive or negative number. This number indicates with an increase or decrease in the number of contracts for that day. It's the changes in the level of contracts that gives the open interest its forecasting value. See the rough sample below of how open interest would appear on a chart depicting a bearish downtrend.

Andy Swan is co-founder and head trader for DaytradeTeam.com. To get all of Andy's day trading, swing trading, and options trading alerts in real time, subscribe to a one-week, all-inclusive trial membership to DaytradeTeam by clicking here.