NASDAQ Commentary
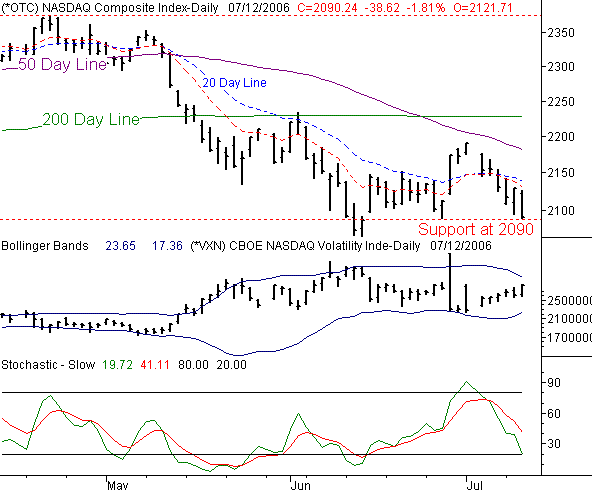
The NASDAQ Composite picked up where it left off last week - headed lower. You may recall that we were pointed higher at the end of June, but July has been all bearish, resulting in a rather heavy does of technical breakdown. Yesterday's 1.8% loss (-38.62 points) brings the composite back down to 2090.24. That's also the same degree of loss for the week, since Monday and Tuesday basically washed each other out. For the month, the composite is lower by 3.8%, and still being pressured lower. Yet, there's still a glimmer of hope if you're a bull. A small glimmer.
The composite just logged its fifth straight day of lower highs, and on four of the last five, we also saw lower lows. Over the last six sessions, we've closed lower four times...and three of those four were significant losses. You don't have to be a rocket scientist to figure out that's bearish. With the momentum pulling the NASDAQ lower, we have to assume more of the same is on the horizon ('the trend is your friend'). The bearish case is even more compelling with the CBOE NASDAQ Volatility Index (VXN) back on the rise.
As for how far the composite could potentially fall, the last couple of crosses back under the 10 day line led to about 100 points worth of loss (May 11th, and June 5th). A repeat of that move would carry the NASDAQ down to no lower than 2000. Bit, it's still a pretty big move, even from Wednesday's close.
There are, however, a few pitfalls with that bearish stance. Note how we've now found support at 2090 on two separate occasions, with yesterday being the second instance. Plus, while the momentum is bearish, the last two downside moves were reversed (sharply) without much warning, or obvious reason. However, there were a couple of less obvious reasons that could come into play again now and prompt such a reversal. One is the VXN's fast approach to the upper Bollinger band, at 24.0. That could press the VXN down again, as stock start to rise. The second is that we're close to being stochastically oversold. In both cases, we're not quite there yet, so we wouldn't expect a big bounce now, if we bounce at all. That move is more likely to occur next week, when this week's pain is out of mind. However, the NASDAQ at least has to tread water now for the bulls to have a fighting chance. Any more breakdown this week, and the bears will be fully in control.
If the composite does indeed go lower, the next level of support is at 2066, or the low for the year hit last month.
NASDAQ Chart

S&P 500 Commentary
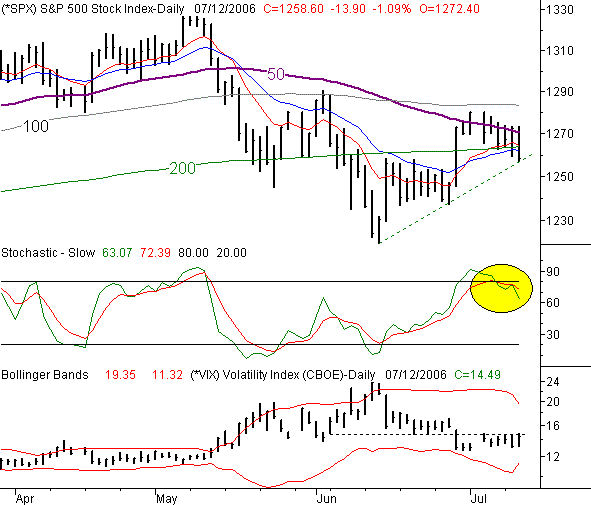
Yesterday's 1.1% loss for the S&P 500 brings the weekly total dip ito the red to only 0.5% (thanks to some moderate gains on Monday and Tuesday). But while the size of the dip is minimal, the degree of resistance that prompted this week's selling is significant. For the month, the SPX is down 0.9%, and yesterday's close at 1258.60 is 11.6 points under June's closing level.
As of yesterday, the S&P 500 is back under all of its key moving averages. While only a second and lower close under those same averages would officially be a bear signal, the chart is still highly foreboding. The 50 day line also ended up being a key resistance point. Plus, take a look at the stochastics chart - its official sell signal is highlighted.
As a reminder, our take on stochastics (and overbought/oversold) is a little unique. Rather than assume a downside reversal is looming just as an index becomes overbought, we wait for evidence that an overbought situation is actually being corrected...with a verified pullback. That signal is the point when both of the stochastic lines are back under the overbought threshold. As you can see, that occurred for the SPX last week. Hence, we're bearish here too.
The only caveats here are the support line that came into view after we hit a low of 1257.30, and the VIX's resistance around 14.80. If that support breaks, things will be even more bearish. If the VIX's resistance breaks, then we're apt to get the same thing...more selling. That makes today a key inflection day for the S&P 500, as there is no room to spare.
S&P 500 Chart

Dow Jones Industrial Average Commentary
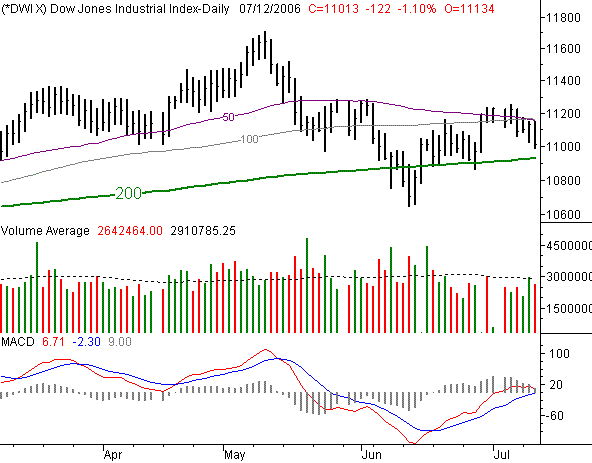
The Dow Jones Industrial Average wasn't immune to a weak market, losing 122 points (-1.1%) on Wednesday to end up at 11,013. That's only 78 points (-0.7%) below where it ended last Friday. For the month, the Dow is down by 137 points (-1.2%), which really isn't all that bad. On the other hand, it's not all that good - the Dow is back under all the key moving average lines except the 200 day line.
As far as our take goes, the story is the same - the bears are really driving things now. Yet, we also have to respect the 200 day moving average line. It's currently at 10,931, and has already been verified as support back at the end of last month. On the flipside, almost everything else about this chart suggests the path of least resistance is still to the downside.
Dow Jones Industrial Average Chart

Price Headley is the founder and chief analyst of BigTrends.com.