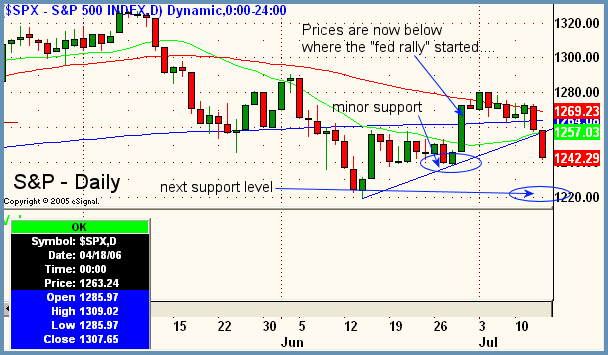
Good Morning, Traders. Geopolitical tensions in the Middle East drove crude prices over $76 per bbl yesterday and smashed equities lower again as the Dow had triple-digit losses for the second straight day in a row. The S&P and Nasdaq got similarly crushed and internals were very bearish. Let's run though the numbers for a minute to see how things played out internally, which is much more important than how much the Dow is down on any given day. My Core Sector List was completely red with all 15 sectors losing from their respective opens. Coal, mining stocks, broker-dealers, and biotechs ended up on the bottom of the list. The breadth, which I feel is the most important measure of market sentiment and is measured by relationship between advancing volume and declining volume (and not advancers and decliners), was very negative. Generally, readings worse than three-to-one negative would imply sellers in firm control. Yesterday's breadth at the close was over six-to-one negative on both the NYSE and the Nasdaq. Along the same lines, declining stocks outnumbered advancing stocks on the NYSE by a measure of 1746 and 1816 on the Nasdsaq. The threshold of what we would consider strong selling on this internal indicator is anything below about 1200. In terms of overall volume, there was a rise yesterday of 20% on both exchanges, marking Thursday's action as a solid distribution day. Overall bias remains down with near-term bias down.
Focus List
NYSE Group
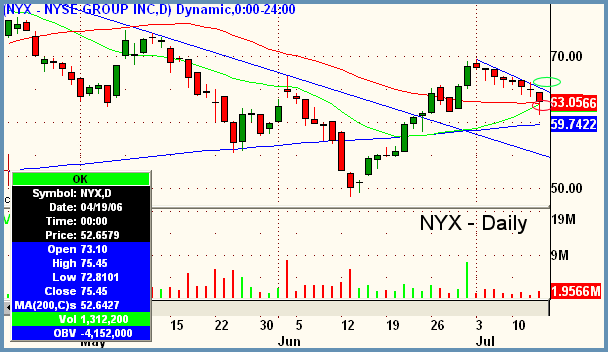
NYX - NYSE Group
Industry - Finacial
Side - Long
Trigger - 64.60
Stop - 63.50 or low of breakout day
Target - 66.50+
Timeframe - 1-3 days
Notes
- Market bias is down currently, this is not a breakout play
- Short term play to capitalize on possible market reversal
- Trail stop immediately upon trigger; "right or right out"
- Entry only on trigger over top of bearish bar printed on 7/13 which would disappoint bears and create a "trap"
Neustar Incorporated
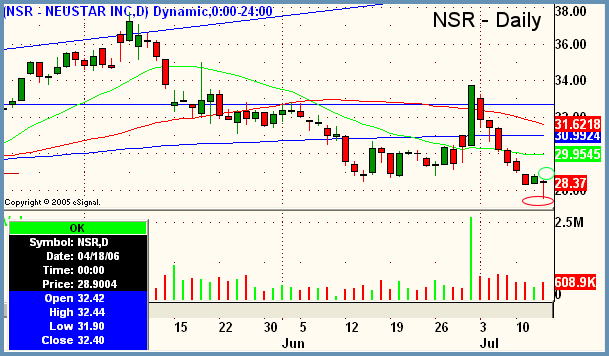
NSR - Neustar Incorporated
Industry - Services (management)
Side - Long
Trigger - 28.66
Stop - 28.25 / 27.45
Target - 30.00+
Timeframe - 1-3 days
Notes
- Market bias is down currently, this is counter-trend
- Short-term play off of hammer reversal where the stock showed some relative strength during selloff of 7/13
- Move stop up immediately after entry; "right or right out"
- Stop can either be under intraday support of 7/13 (first number) or low of reversal day (second number)
Peter Reznicek is the Chief Equity Strategist and a principal of the Prana Fund, a domestic hedge fund, and ShadowTrader, a subsidiary of thinkorswim which provides coaching and education to its clients on both intraday and swing trading of equities. For a free trial to the full version of The Big Picture or to learn about ShadowTrader's other services, visit shadowtrader.net or send an email to preznicek@shadowtrader.net.


 Free Festival of Traders Videos