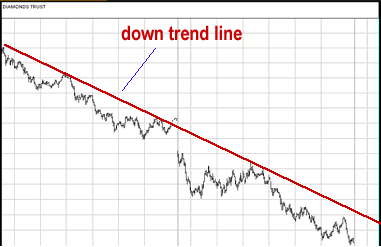
The Diamond Trust (DIA) is comprised of the 30 stocks that make up the Dow Jones Industrial Average. A look at the 2-day chart and it's easy to see this ETF has had some trouble the past two days. DIA is in a solid downtrend, with several successful down trendline resistance tests.
This down trend line will give us a good indication as to the potential direction of the market. DIA should pullback to down trend line resistance early in the session. If it reacts to the resistance and moves lower, the market will likely continue to weaken. If DIA breaks through down trend line resistance, the resistance will then be support and the market should strengthen.

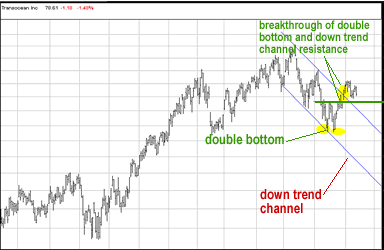
Here's what I see when looking at the 1-year chart for Transocean Inc. (RIG). The stock recently began trading in a down trend channel after breaking out of an uptrend. Recent price action has cause a double bottom reversal in the stock. RIG was able to break through middle valley resistance, verifying the fact that this is indeed a double bottom formation. The middle valley resistance break out pushed RIG through downtrend channel resistance. The stock is now retracing to the double bottom break out point.
After the retrace is complete, RIG should climb higher and complete the "post double bottom break out" move. The size of the move should be equal to the difference between the price at the bottoms of the double bottom and the price at middle valley resistance. In this case, that means a move to approximately 83.

Andy Swan is co-founder and head trader for DaytradeTeam.com. To get all of Andy's day trading, swing trading, and options trading alerts in real time, subscribe to a one-week, all-inclusive trial membership to DaytradeTeam by clicking here.