The US equity markets are hit hard again this week, as another round of selling takes the NASDAQ to prices unseen in over one year. The S&P 500 and Dow which represent the upper echelon of US equities are struggling as well, but still remain relatively strong. The NASDAQ, which represents the equity market's "appetite for risk" is leading the way down. In a certain way, this is no surprise, as we have identified the NASDAQ as a very ill index for many months now. But what is surprising is exactly how weak it is, as it is barely able to produce any meaningful bounce from prior sell-offs.
This weakness in the NASDAQ permeates its way across the entire spectrum of premier US equity issues. But within the NASDAQ itself, the root source of the weakness is the Semi-Conductor sector, which has just recently fell off some more important support points. Let's take a look at the charts, beginning with the NASDAQ. Later, we will look at the Semi-Conductors, and also take a look at that 'other' hot market nowadays, GOLD:

Chart Notations:
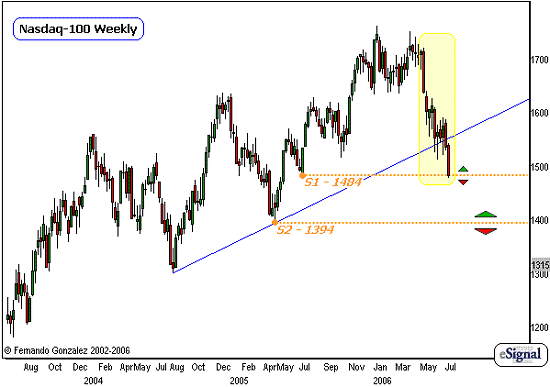
The Weekly chart of the NASDAQ-100 above addresses the short-to-intermediate-term time horizon.
Although I pointed out last week that the market was vulnerable to another round of selling later on in the month, this is one of those times where I can say once again, that the market never ceases to surprise me, no matter how well I calculate and anticipate its future action. This market is really a lot weaker than I had originally anticipated. While the corrective action continues in the S&P 500 and Dow as I had expected, the lack of Bids in the NASDAQ is very mind boggling. Perhaps it has been this a very long time, years, since its low point that I have seen the NASDAQ this weak. This is, after all, the fastest and steepest selling we have seen in the NASDAQ in more than 4 years.
This lack of bids is not a very good sign for the bulls, particularly for this time horizon - the remainder of the year - it suggests even more selling in the weeks and months ahead. Just take a look at the speed of the decline (yellow highlighted area) and you can visualize, quite easily, a larger decline later.
Either way, we have marked for this time frame the key support areas underneath the trendline. Let us note that while the market is carrying plenty of downside momentum, the market is also approaching very oversold levels on the short-term time horizons. The risks for violent movement are quite high in the days ahead. Short-term traders should keep this in mind, maintain a very high level of risk management so as not to be over-exposed to either direction for too long, and keep a very close tab on appropriate support and resistance levels for the time-frame they are trading.

Chart Notations:
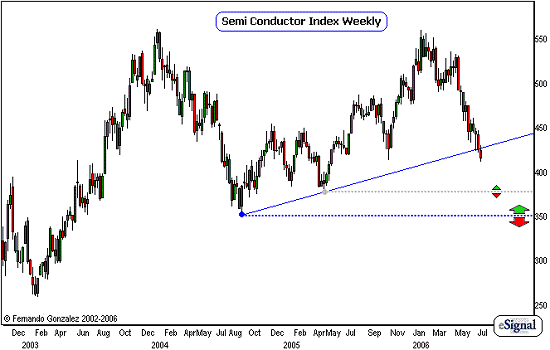
The Weekly chart of the PHLX Semi Conductor Index ($SOX) above addresses the short-to-intermediate-term time horizon (~3-9 mos). This is an update to our chart from last week.
The SOX has already lost greater than 20% of its value since its high point and is moving at a much faster rate than the NASDAQ. The main source of the weakness in the NASDAQ is coming from this Sector.
The speed of the recent decline from the highs suggests more selling later, although the market is in some oversold short-term levels and also sitting just underneath an important, primary-degree trendline for this time frame.
The risks to the downside for this time horizon remain large in this market, and in play so long as the market is trading below the trendline. Let's keep this (according to the appropriate time horizon) in mind, as this market leads the NASDAQ, which in turn, greatly affects the S&P 500 and Dow.

Chart Notations:
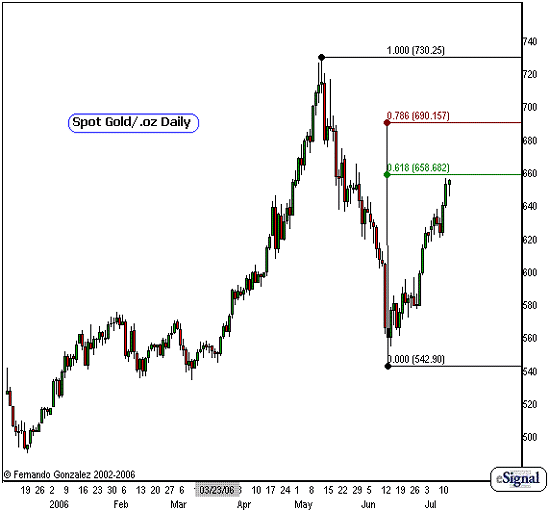
Above is the daily chart on Spot Gold, going back to the end of 2005, and follows up on our last update on this market on June 14, where I issued a buy signal.
The decline from the high point in May has been a huge one, and the market is now attempting to recover its losses. The bounce from the low point in June has been very strong as well, and is now reaching its first challenge point in time and price. The move into its Fibonacci 62% retracement point (green) is likely to be met with a strong challenge from sellers. This is a good area for short-term players who took advantage of our buy signal in mid-June to take their profits, and there is plenty.
If the market produces a Daily close above the Fib 62% retracement point (at $658), this puts the next Fib level into play towards $690 (maroon), so long as the market is trading above the $650 mark.
At this point, we will assume that this rally is merely corrective in nature, and is likely to be met with plenty of resistance at the Fib marks above. But Gold is a very special market. If over the short-term time horizon, it is able to move above the 78% Fib retrace point (maroon at $690), a powerful move towards the milestone mark at $1,000 and a new all-time high is VERY LIKELY. While the thought is very exciting indeed, let us take the market one step at a time, as we are always supposed to.
Fernando Gonzalez is in his 10th year as an active trader, technical analyst and content contributor to the active trading community and a long list of popular financial media. Online Trading Academy trading knowledge...your most valuable form of capital.