NASDAQ Commentary
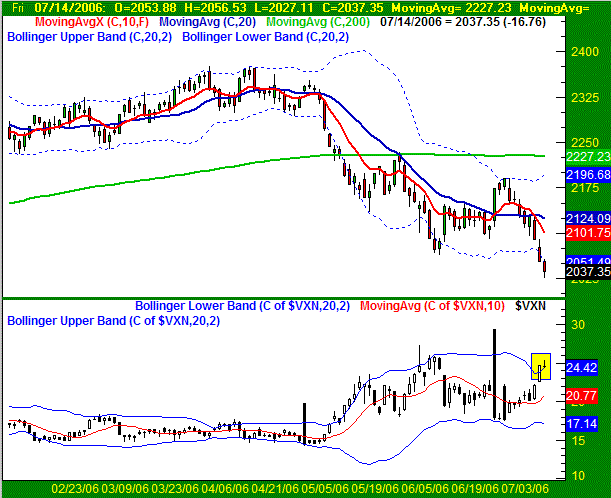
The NASDAQ's close at 2037.35 last week was the result of a 92.71 loss, a 4.35% dip, which was the second-worst weekly decline we've seen all year. Along the way, we hit a new year-low of 2027.11, so clearly, the bears are going strong. However, although the momentum is technically bearish, could there be other signs that a bullish reversal is in the works? It's a real possibility.
In terms of momentum, we'd have to give the edge to the sellers. However, the tumble last week may have been a little too much, too fast. As a result, the odds favor at least a short-term bounce, which even has the potential to turn into a long-term rally. There are two key pieces of data we see that cue that possibility, but the philosophy of both is the same - last week was so bad, it may have been the final culmination of the selling effort.
Take a look at the lower Bollinger band (blue, dashed). The lower band line has been a reversal point, as we say in February and March. Or, the lower band line has been a guideline, allowing the composite to slide lower as we saw in May. But now, we're seeing something we haven't seen this year. The NASDAQ is well under the lower band line, having almost made two bearish gaps on the way there. Either this is the beginning of a major breakdown, or we've finally hit rock-bottom with one major plunge. Either is possible, but given what we see with the VXN, we tend to expect the latter.
The CBOE Volatility Index (or VXN) is also dancing with its upper Bollinger band. It surged up to it on Thursday. Even though we actually saw the VXN close even on Friday - and slightly above the upper Bollinger band - it's clear that the pace of VXN gain has tapered, even though the market's didn't. In fact, the VXN was pulling well off its highs from Friday, suggesting that investors were planning for bullish days, even though stocks were still sinking on Friday.
At this point its still too soon to call, but we do want to affirm that these charts are so overwhelmingly bearish, it's a little suspect. It may well be a short-term capitulation. We'll have an answer by Monday or so.
NASDAQ Chart 
S&P 500 Commentary
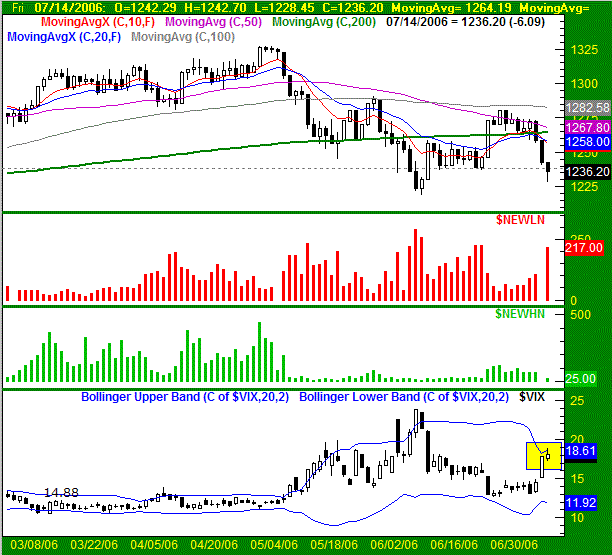
The S&P 500 lost the least last week, only giving up 2.32%. The 29.3 point loss left the large-cap index at a close of 1236.20 on Friday. Unlike the NASDAQ, the SPX did NOT hit new lows, but being under all the key moving averages is bearish all the same. Yet, like the NASDAQ, there are some obscure clues that a bounce may be in our very near future.
Like the NASDAQ, things were awful last week for the S&P 500, yet there are a couple of signs that could mean we're at a bottom. The S&P 500's Volatility Index (the VIX) is also struggling with its upper Bollinger band line after reaching it on Friday. This suggests traders are easing out of the bearish positions they were in on Thursday, and scaling into bullish ones - albeit to a minor degree. Note how the VIX closed well under its highs from Friday. Simultaneously, the S&P 500 closed well above its lows from Friday...so clearly somebody was buying then. It's particularly bullish, since the week was one of the worst in a long time, and should have spooked most everybody out of stocks. Instead, it looks like fear peaked, and now the bulls are trying to test the waters.
One of our other clues that we may have finally just hot a bottom is the extreme readings we have in our new NYSE highs and new NYSE lows from Friday. The data appears in the middle of our chart (in two separate sections). The levels were 25 and 217, respectively, which has historically been levels where bounces started. See early June for an example of how things can get so bearish, only buyers are left. The tricky part is a timeframe. Sometimes the uptrend is small and short, like June's. Other times, we've seen it last for weeks, and generate some major gains. We never really know that for sure. What we do know is that a bounce is very very likely.
One last thought on the SPX...although we traded under this line on an intra-day basis on Friday, there's some loose support around 1236. That's right where we closed out for the week, and it's also where the S&P 500 found support several times in June. Just keep that line on your radar.
S&P 500 Chart 
Dow Jones Industrial Average Commentary
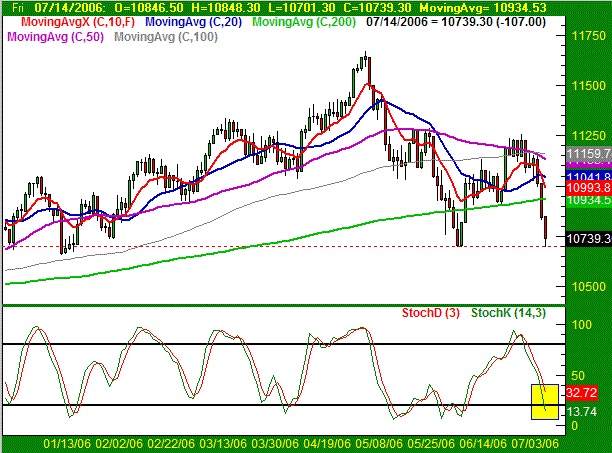
The Dow closed at 10,739 on Friday, or 352 points under the prior week's close. That's good for a loss of 3.17%. However, the Dow didn't make a new low for the year either. In fact, the Dow seems to have found support at the 10,700 area for the fourth time this year (with the first instance occurring in January). The bulls - whether they even realize it or not - have drawn a line in the sand at that mark. So, for the Dow, it's truly a do-or-die situation right now.
Nothing really new here - the Dow got hammered like everything else, and the current momentum is bearish. But, like everything else. it got so bad last week, it would be surprising to not see an upside move.
The one thing we want to add (ok, need to add) here is the support at 10,700. That's basically where we bottomed on Friday and in June, and close to where we made short-term bottoms three times in January. That support is also what kept the Dow from making new lows for the year. So yeah, we think it's a very important line. In fact, as far as support goes, it's the one and only line to watch. If it breaks, and the other indices follow suite, stocks could continue to deteriorate.
Fortunately for the bulls, being stochastically oversold at the same time support at 11,700 has become obvious makes it much easier for other buyers to justify taking a chance on getting back into the market now.
Dow Jones Industrial Average Chart 
Price Headley is the founder and chief analyst of BigTrends.com.