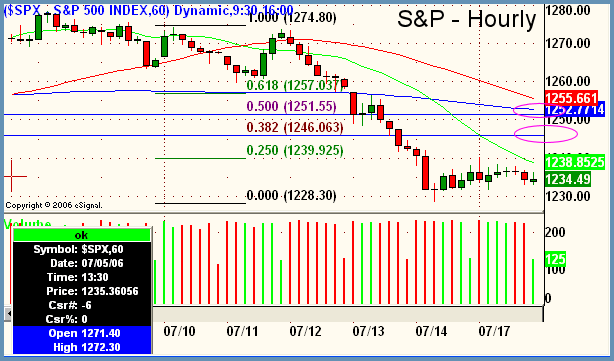
Good Morning, Traders. It's been almost two full days of consolidation in the markets now as we edge closer and closer to options expiry at the end of this week. We were completely sideways on all three averages as the Dow closed up 8.01, the S&P down 1.71 and the Nasdaq Composite ahead by a whopping 0.37! Divergence between internals on the NYSE and Nasdaq and also between different sectors was the overriding theme of the day. This is typical as it's this tug of war between the strong and weak sectors that causes the closes on the major averages to be so close to the prior days close or "zero-line" as we call it. We've selected an hourly chart below to show the consolidation by time and not price that has been occurring since last weeks selloff and also to look at some possible Fibonacci retracement scenarios that could happen if the market were to rise a bit from here. The first thing to note on the chart is simply that the price has moved straight sideways with only a small incline to the upside for almost two full days. This would have to be construed as bearish since it's a correction by time and not price. Note that no bounce from the prior down move has yet occurred. There has been a very slight rise but note how all of the hourly bars that comprise it have been of the small body variety. This indicates a lack of emotion on the part of those who would have to cover their shorts here or initiate new long positions. Secondly, if we do get a move to the upside in the S&P the two Fibonacci retracement price targets (circled in purple) would be logical spots for the market to pivot. Going forward into today's trade, it should be relatively easy to gauge intraday direction because of how narrow this consolidation has been over the last two days. Very simply, if we move up over the top, it's a relatively obvious move toward at least the first and maybe both of the Fibonacci areas. If we move below the consolidation area and the lows of 7.14, then sellers once again take the upper hand and the market's volatility would expand to the downside. Keep in mind that with options expiry coming this Friday, there is also the possibility of neither occurring as stocks just get pushed around to different strike prices without really having any meaningful advance or decline. The overall bias continues to be down with a near-term bias of sideways for now.

Focus List

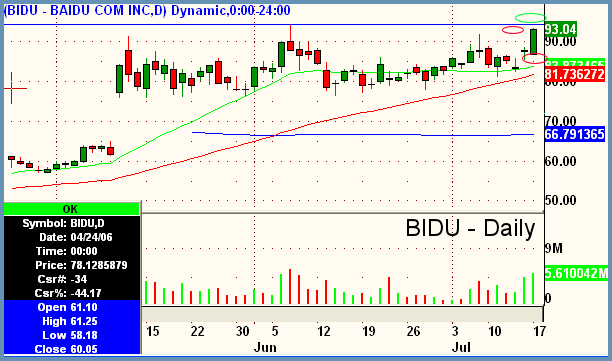
BIDU - Baidu.com
Industry - Internet
Side - Long
Trigger - 94.35
Stop - 86.20 or under low of breakout day
Target - 110.00+
Timeframe - one week to multiweek
Notes
- Internet and tech-related issues are in a slump right now, but this is a Chinese company and is a recent IPO which puts it in a different category.
- Breakouts are tricky in this environment.
- Stock has huge beta, so size appropriately.
- First stop listed is under low of big body candle of 7/17, which is the only relevant pivot at this point but would present a very wide stop point upon entry. Low of day of breakout day is more realistic. Trail stops quickly.

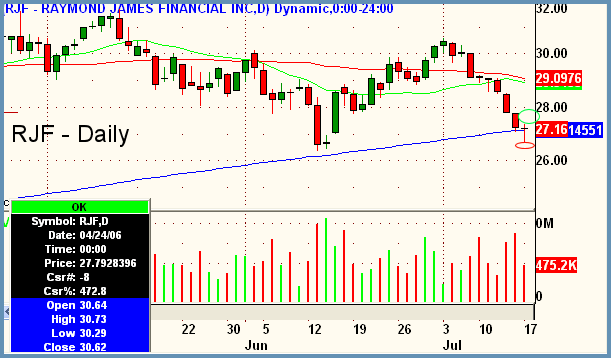
EEFT - Raymond James Financial
Industry - Brokerage (regional)
Side - Long
Trigger - 27.40
Stop - 26.60
Target - 28.20+
Timeframe - 1-3 days
Notes
- Hammer on dailies for reversal play.
- Short-term play off of 200 ma and prior lows.
- Move stop up immediately after entry; "right or right out."
- Target listed is for 1:1 risk reward but bounce could easily move to retest converging 20- and 50-period moving averages above at $29 area.
Peter Reznicek is the Chief Equity Strategist and a principal of the Prana Fund, a domestic hedge fund, and ShadowTrader, a subsidiary of thinkorswim which provides coaching and education to its clients on both intraday and swing trading of equities. For a free trial to the full version of The Big Picture or to learn about ShadowTrader's other services, visit shadowtrader.net or send an email to preznicek@shadowtrader.net.