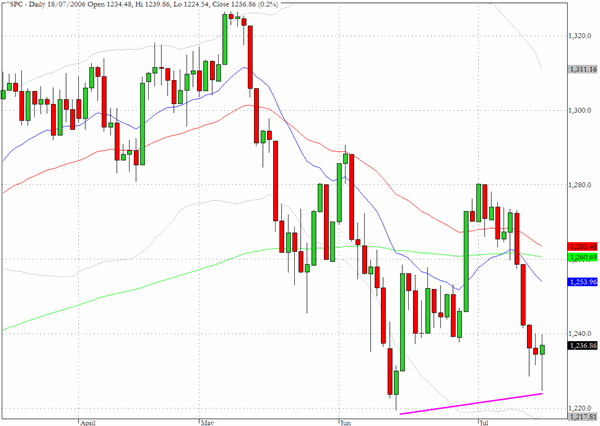
The indices staged strong reversals in yesterday's trading as the lows from June came into play. The S&P 500 reached 1224 intraday but buyers stepped into arrest the decline to the June 13/14 lows. After reversing in afternoon trading the index headed back towards the 1240 level where resistance was met and the index closed at 1236.
The long lower tail to yesterday's trading and the better than average volume (the SPY proxy registered one and one half times the 15-day SMA for volume) could be pointing to a recovery effort that should take us back to 1260.
The Russell 2000 (^RUT) headed down towards the mid June lows and came within a point of June 14th's intraday low just below 670. The index reversed back above the 680 level for a 0.6% gain for the day. The chart pattern certainly seems to be indicating a recovery pattern but caution would seem to be advisable given the current newsflow.

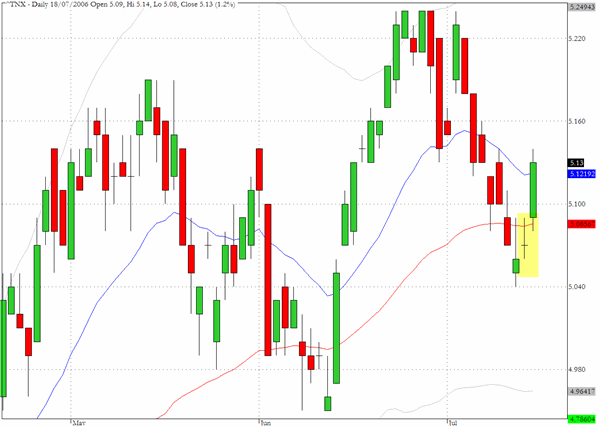
As anticipated in yesterday√Ę‚,¨‚"Ęs column, yields in the Treasury market moved back upwards following the turning point signal indicated by Monday√Ę‚,¨‚"Ęs candlestick formation. Yields ticked up by six basis points and fixed income traders will be paying close attention to Bernanke√Ę‚,¨‚"Ęs testimony today. It remains to be seen whether 5.25% will continue to present a ceiling for yields in the coming weeks.
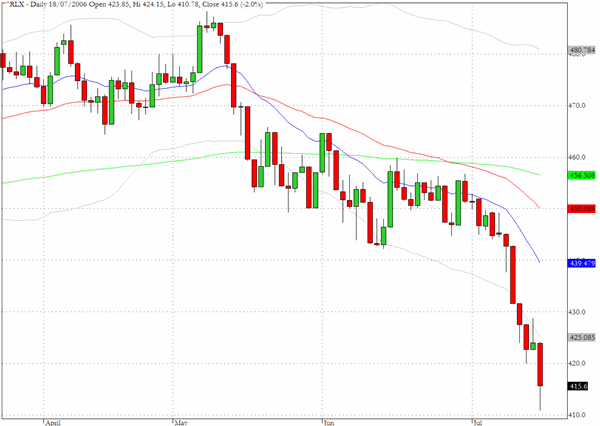
The retail sector fund (^RLX) was unable to find support at 420 which marked the lows from last September/October and now seems to be headed towards the lows from May 2005 just below the 400 level.
TRADE OPPORTUNITIES/SETUPS FOR WEDNESDAY JULY 19, 2006
The patterns identified below should be considered as indicative of eventual price direction in forthcoming trading sessions. None of these setups should be seen as specifically opportune for the current trading session.
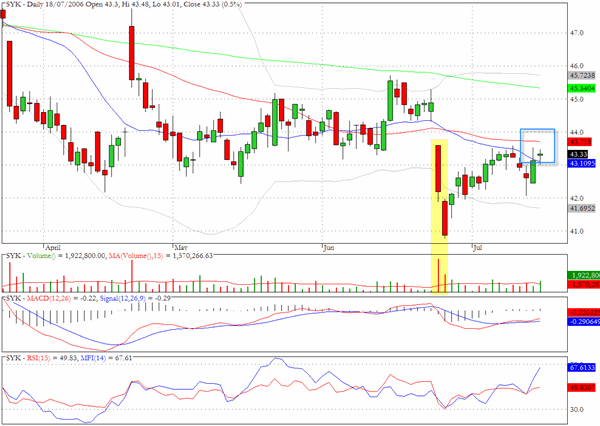
Stryker could run into further selling as the 50 day EMA is approached.
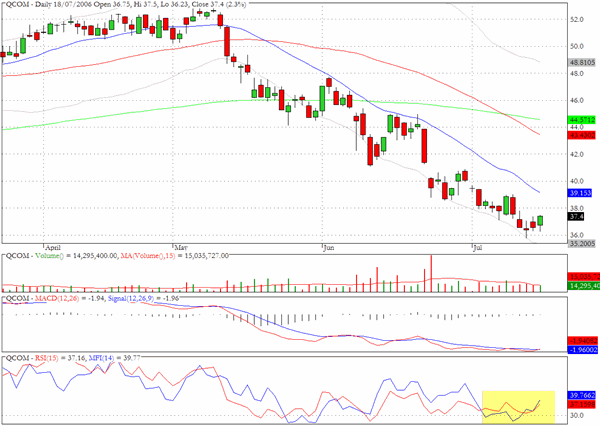
Several of the big name tech stocks have been in a downward staircase pattern for several weeks as evidenced by the chart for Qualcomm (QCOM). The momentum and money flow charts suggest that yesterday's 2.3% move upwards may have been the beginning of a recovery effort. There is no reason to be too keen at current levels as we sense that there could be more swithbacks ahead but in the intermediate term we would not be surprised to see the $44 level being tested.
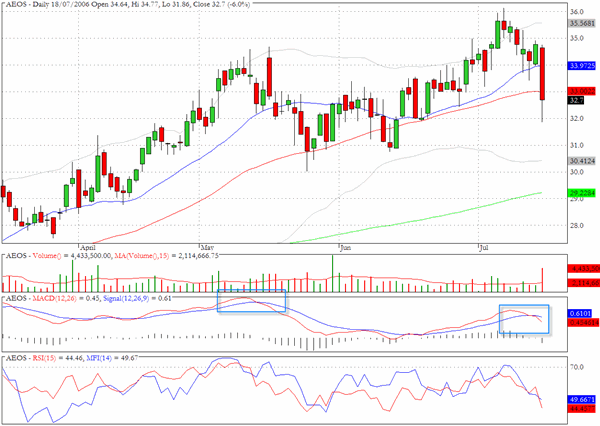
American Eagle Outiftters (AEOS) dropped sharply yesterday and we thought it would be instructive to look at the MACD chart that was revealing fairly noticeable negative divergence as prices recently broke to new highs.
Clive Corcoran is the publisher of TradeWithForm.com, which provides daily analysis and commentary on the US stock market. He specializes in market neutral investing and and is currently working on a book about the benefits of trading with long/short strategies, which is scheduled for publication later this year.
Disclaimer
The purpose of this article is to offer you the chance to review the trading methodology, risk reduction strategies and portfolio construction techniques described at tradewithform.com. There is no guarantee that the trading strategies advocated will be profitable. Moreover, there is a risk that following these strategies will lead to loss of capital. Past results are no guarante of future results. Trading stocks and CFD's can yield large rewards, but also has large potential risks. Trading with leverage can be especially risky. You should be fully aware of the risks of trading in the capital markets. You are strongly advised not to trade with capital.