NASDAQ Commentary
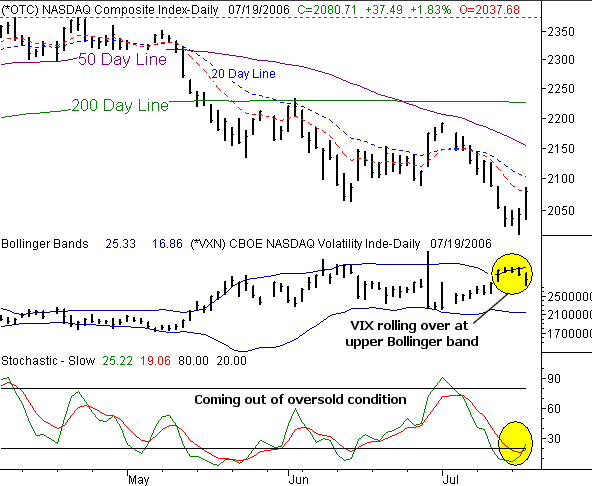
The NASDAQ Composite's 1.83 percent gain yesterday left the index at 2080.71. That's 37.49 points higher than Tuesday's close, which translates into a 2.13 percent gain for the week so far. However, there's still some major technical resistance right where the composite ended yesterday. It remains to be seen whether or not we'll end this week on a bullish note. However, most indications are indeed bullish.
There are two key drivers behind the current bullish outlook. One is the CBOE NASDAQ Volatility Index (VXN). The other is the stochastic lines.
The VXN hit a high of 25.42 on Tuesday. However, it actually started falling a couple days before that when it hit the upper Bollinger band. We saw a couple of closes above the upper band, but Monday's close under that band suggested a rollover. Since that time the VXN's downtrend has accelerated. The volatility index closed at 22.83 on Wednesday, down 1.06 points. With the lower band only at 16.8, there's still plenty of room for the VXN to fall. By default, that also leaves plenty of room for the NASDAQ to rise.
Simultaneously, you can also see that both of the stochastic lines are now pushing up and above the oversold threshold. Although we knew the NASDAQ was technically oversold, with both lines moving back above 20, we now know the oversold condition is being corrected. This is a bullish sign in itself, but combined with the VXN's rollover, the bullish signal is that much stronger.
That said, there's still a problem with resistance at the short-term moving averages. As we saw yesterday, the 10-day line capped the NASDAQ's rise, on a closing basis. Assuming that we can even get past that line today, the 20-day line still looms ahead at 2104. That's just 24 points away from where we are now, however, so we may not have to wait that long until we get an answer.
In the meantime, support is that 2012, while resistance is at 2080, 2104,and ultimately the 50-day line at 2154. We've not been above the 50 day moving average since early May.
NASDAQ Chart

S&P 500 Commentary
The S&P 500 slightly topped the NASDAQ yesterday, gaining 1.86 percent. The 22.95 point gain left the index at 1259.8 by the closing bell. For the week, the SPX is up by 1.91 percent, or 23.6 points. Clearly most of the gain came on Wednesday's rise. Unlike the NASDAQ however, the S&P 500 actually managed to get back above its 10- and 20-day lines. More than that, it's within striking distance of the 50- and 200-day lines. Both of those lines are right at 1263, or just three points away from where the index closed yesterday.
The SPX's version of a volatility index (the VIX), like the NASDAQ's, hit resistance at the upper band line late last week. And of course, it too fell sharply yesterday. That's bullish. However there is no need to rehash the same basic scenario in our analysis of the S&P 500. Instead, we'd like to look at something a little more obscure, and perhaps a little more effective.
Here at BigTrends.com, we're contrarians. That can be very profitable, but it also requires patience in between rare opportunities. But when you get an opportunity, you have to respond quickly because they don't come along very often. That's why were so excited about the potential bullishness that was presented late last week and early this week.
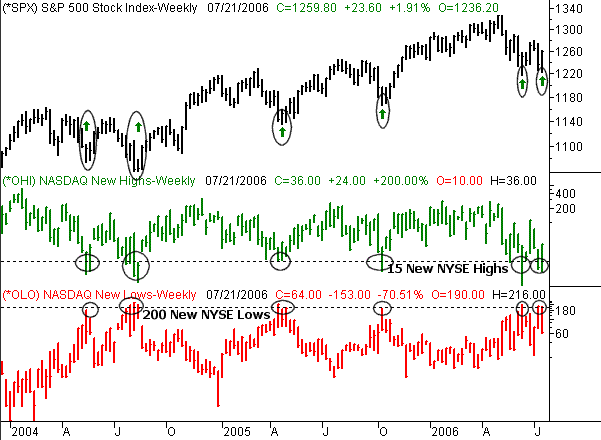
We've talked about the new NYSE highs in new NYSE lows before. Whenever either one moves to an extreme level, we know a reversal is very likely. In fact, we've seen it happen many times in the last year or so. For instance, on October 12 of last year, the number of new NYSE high's fell to 10, while the number of new NYSE lows peaked at 202. Both readings were multi-month extremes. At that time the market was also in a multi-week downtrend, and looked very bearish. But, the market's low that day ended up being the bottom, while the extreme reading in new NYSE highs and lows was a sign of a small capitulation. We saw the same thing occur on June 13 of this year. The number of new NYSE Lowe's hit 237. The next day, there were only 5 new NYSE highs. That ended up being a short-term bottom for the market, and set up a pretty nice three-week rally.
Well, we basically saw the same extreme readings last week. For four straight days, the number of new NYSE lows hovered at 200. At the same time (during the same four days) the number of new NYSE highs has been hovering near 11. For lack of a better way of saying it, that's just more than the market can take. Hence, yesterday's explosion to the upside. Based on history, there still a lot more buying to be done to bring the new highs and lows back into balance. In general, there should be about 100 new highs in everyday, and only about 40 new lows made everyday at the New York Stock Exchange. Be sure to check out the chart for examples of how effective this indication is.
S&P 500 Chart

Dow Jones Industrial Average Commentary
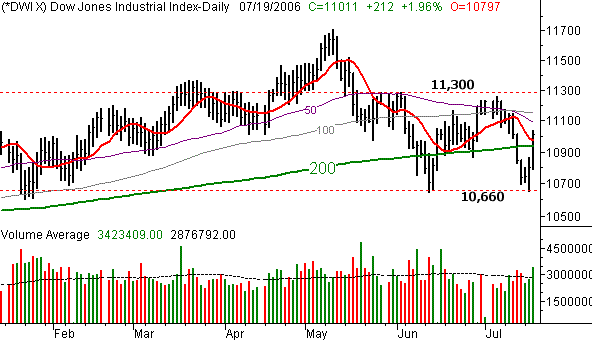
The Dow Jones Industrial Average topped both the NASDAQ and the S&P 500 yesterday with its 1.96 percent gain. The 212 point rally left the index at 11,011. The move also pushed the index back above the 200-day line as well as the 10-day line, and the move was made on pretty strong volume too.
However, at this point, it would be wise to wait just a little longer before getting too bullish on the Dow. While we crossed couple of major hurdles yesterday, the 50 day line looms ahead at 11093, while the 100-day line lies ahead at 11,153. Both have been resistance before, and you don't want to risk that happening again.
As far as the Dow Jones Industrial Average is concerned, only a couple of closes above 11,300 would convince us to really get excited as bulls. That was near all that resistance we were facing back in May and early June (marked with a dashed line on the chart). At the same time, however, notice how there is support at 10,660. We bottomed there in mid-June as well as a couple days ago. Only a close back under that line would have us worried, or move us back to a bearish stance.
Dow Jones Industrial Average Chart

Price Headley is the founder and chief analyst of BigTrends.com.