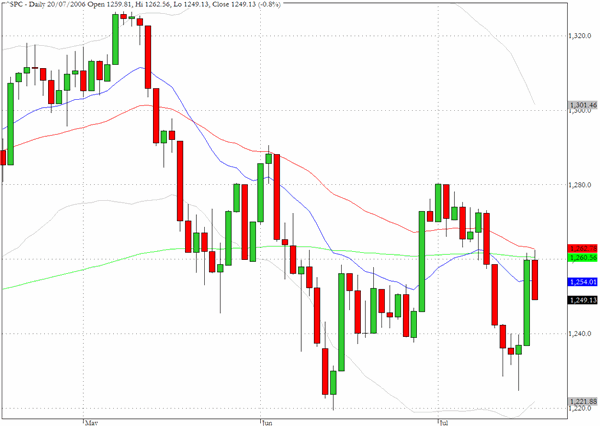
The indices failed to follow through on Wednesday's powerful advance. The S&P 500 suffered less than many indices as it retreated by 0.8% after failing to make any progress above 1260. The current market is presenting unusually difficult trading conditions and our scanning of the daily chart formations at the moment is offering very few solid multi-day opportunities.
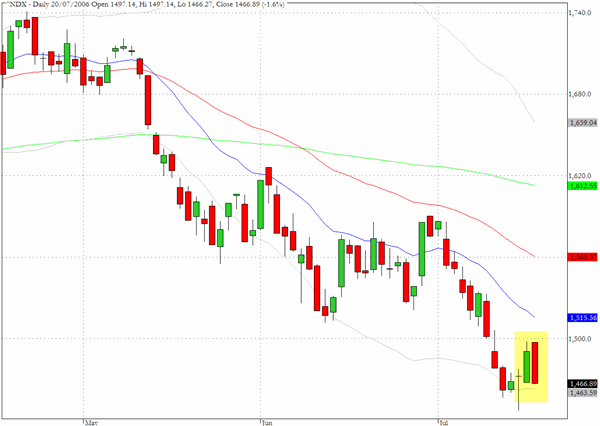
The chart for the Nasdaq 100 (^NDX) shows a rather striking back to back reversal pattern as the index erased its gains from Wednesday with a 1.6% loss. Yesterday's weak performance was underscored by the fact that the closing price at 1466 was actually below Wednesday's low. Intel's downbeat forecast was undoubtedly a contributor to the sorry performance of the Nasdaq stocks in general, and the persistent weakness of the top 100 Nasdaq stocks points to a deep seated malaise for the tech sector that is undermining market sentiment.
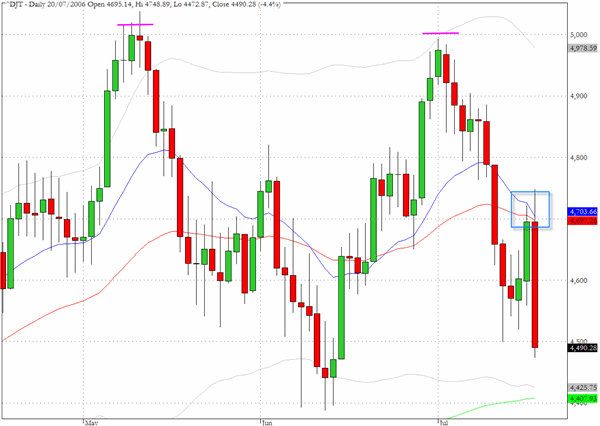
One of the biggest drops yesterday was experienced by the Dow Jones Transportation index which fell back by 4.4%. As the chart reveals there is a lower high in place and we appear to be headed back towards the mid June lows. Overall this index has provided one of the better performances for the year so far as it began in January at 4196 and even after yesterday√Ę‚,¨‚"Ęs sell-off the index has a vear to date gain of 7%.
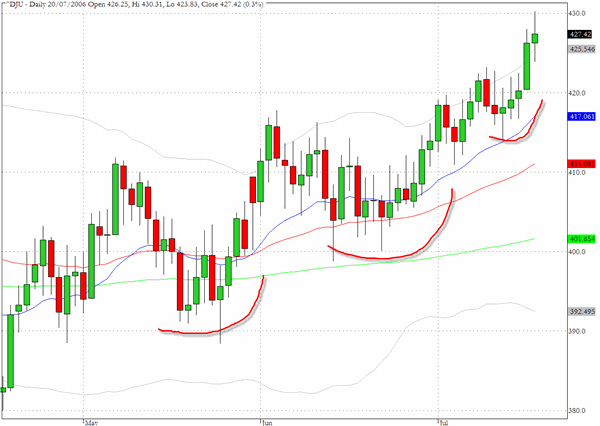
A very different picture to that for the Transports emerges for the Dow Junes Utilities Index which continues to push up towards the late October 2005 all time highs at 440. The gain of 0.3% for the index was one of the very few positive performances in yesterday's negative session.
TRADE OPPORTUNITIES/SETUPS FOR FRIDAY JULY 21, 2006
The patterns identified below should be considered as indicative of eventual price direction in forthcoming trading sessions. None of these setups should be seen as specifically opportune for the current trading session.
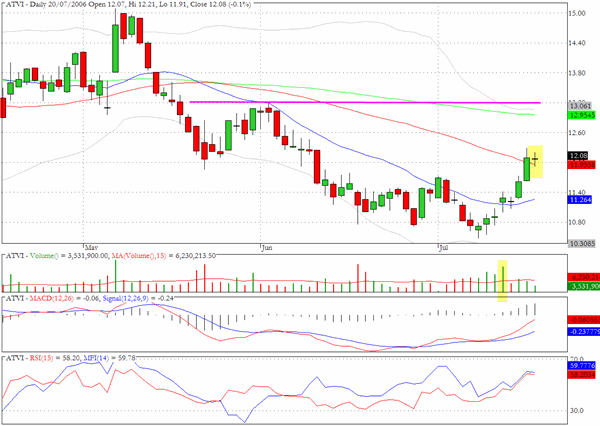
Given our caution, expressed above, about the difficult trading conditions at present any suggestion must be considered with a longer time frame than usual. Activision (ATVI) is an example of what we mean. The chart suggests that a target of $13 is appropriate in the intermediate time frame (five to ten days) but we could retreat abruptly before we move up.
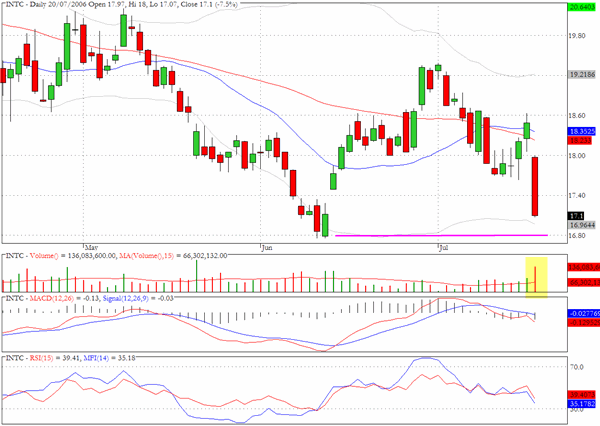
The weaker than expected outlook from Intel hit the stock hard yesterday. The drop of 7.5% on twice the average daily volume raises the prospect that the mid June lows will be taken out. By way of historical context Intel's lowest point since the bursting of the Nasdaq bubble occured in early October 2002 when the stock dropped below $13 and the top of the bubble occurred in August 2000 with several closes above $70.
Clive Corcoran is the publisher of TradeWithForm.com, which provides daily analysis and commentary on the US stock market. He specializes in market neutral investing and and is currently working on a book about the benefits of trading with long/short strategies, which is scheduled for publication later this year.
Disclaimer
The purpose of this article is to offer you the chance to review the trading methodology, risk reduction strategies and portfolio construction techniques described at tradewithform.com. There is no guarantee that the trading strategies advocated will be profitable. Moreover, there is a risk that following these strategies will lead to loss of capital. Past results are no guarante of future results. Trading stocks and CFD's can yield large rewards, but also has large potential risks. Trading with leverage can be especially risky. You should be fully aware of the risks of trading in the capital markets. You are strongly advised not to trade with capital.