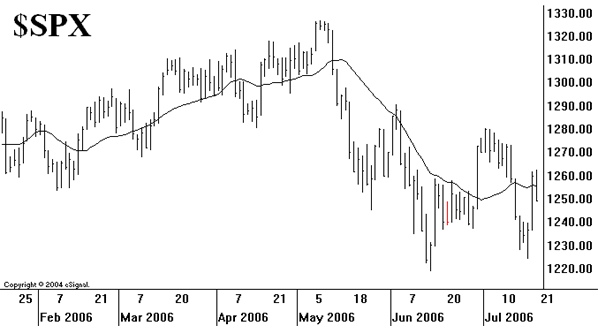
This market is exhibiting all the classic behavior of a traditional bear market: sharp, but short-lived rallies sprinkled in amongst an ongoing downtrend. The rallies are so fierce that, at face value, they appear to be an end to the decline. But since they have no follow-through to them, the bears continually reassert their will.
$SPX has established a new support level in the 1220-1228 area. Do you notice how each support level is a little lower than the one before? That's classic bear market action as well. Also each rally dies at a slightly lower level: the May top was at 1290, then the June top was at 1280, and now it appears that July may have topped out around 1265 (although admittedly July isn't over yet). While we don't necessarily give a lot of credence to the 100-day moving average of $SPX, it is interesting to note that it has contained all rallies since it was first breached in mid-May. It remains at 1280 today. The $SPX chart is one of the more negative aspects of the indicators we follow (although it's not as negative as the charts of QQQQ, $DJX, or $RUT -- all of which made new lows or came within a small fraction of doing so this week). The $SPX chart will remain negative until one of the previous resistance areas can be overcome.

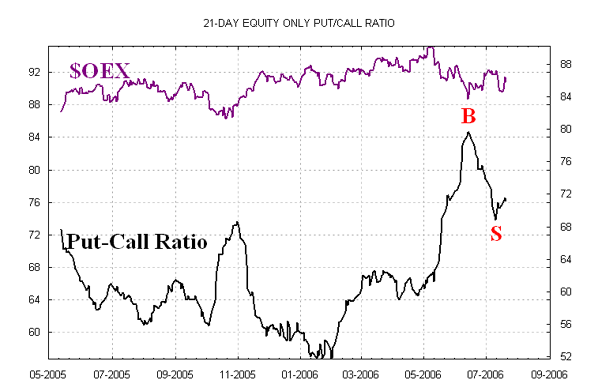
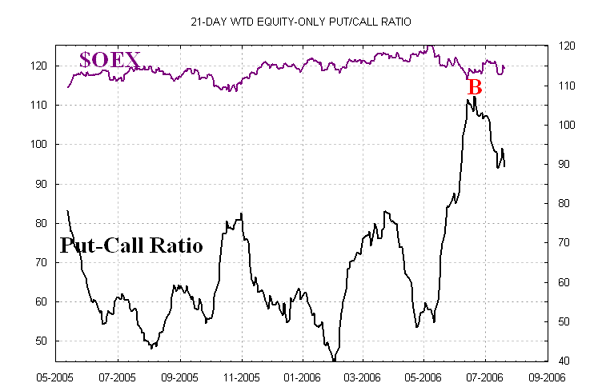
The equity-only put-call ratios have been one of the most steadfast bullish indicators, but that is now changing. A series of extremely high put-call ratio readings on the standard ratio this week has pushed it higher, and thus the standard ratio is now back on a sell signal. Admittedly it is high on its chart and it will probably give another buy signal fairly soon. But it is also in a state that we must consider as extremely oversold -- a state which sometimes lead to severe market declines before true buy signals arise. As we always say, "oversold does not mean buy." The weighted ratio has suffered much the same fate, but our computer projections have not officially downgraded it to a sell signal as of this date.


Breadth continues to jump back and forth with every little market whim. We can't totally give up on breadth as an indicator, even though it is whimsical of late, because -- for example the most recent decline (From the $SPX 1280 level) was really only signaled by the breadth sell signals.
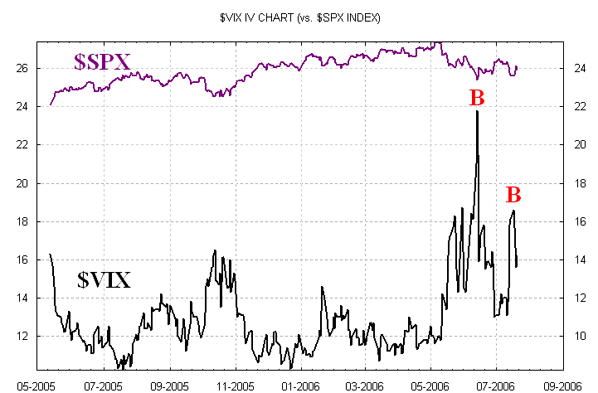
Finally, the volatility indices have put in place another spike peak buy signal on their charts. After reaching a high above 19 earlier this week, they fell to 16 or lower during the rally. That's enough of a reversal to be considered a buy signal for the short term. From a longer-term perspective, $VIX is now increasing in value, and that generally is a negative for the market.

In summary, we don't feel particularly good about this market. Buysignals are very short-term at best, and rallies don't hold. Until the put-call ratios can get back on buy signals and until $SPX can overcome some of the important resistance levels, we will continue to take a bearish viewpoint.
Lawrence G. McMillan is the author of two best selling books on options, including Options as a Strategic Investment, recognized as essential resources for any serious option trader's library.