The Stochastic is a popular oscillator that was made popular by George Lane. Most of today's software programs use stochastics. There are two lines in stochastics- %K and %D. %D is just a 3-period moving average of %K. These lines move according to a security's movement in relation to a recent high or low, and you can adjust this range. A common length is 14. Keep in mind that the faster your speed, the more entries you will have, and also the more you will get whipped out. If you slow down the speed, you are more likely to catch larger trends. There are also two versions of stochastics: slow and fast. Stochastics slow tends to be less speedy (brilliant right?) and tends to create less market entries and tends to be better at catching more powerful trends.
Trading Techniques
When the market is in a trading range, I like to buy when the %K line crosses over the %D line while under the oversold line. It tends to pick up major bottoms. When using stochastics, I prefer to use a length in the 20's. Lengths in the 20's have tested very well for me.
Overbought/Oversold Strategies
If you feel like the market is in a trading range and will continue in this fashion, an effective strategy is to sell when overbought and buy when oversold levels are reached. Be cautioned that if the market surges to the upside in a powerful trend, this strategy often results in missing a large portion of the upswing and repeated false sell signals. The opposite is true in bearish downtrends where stochastics continues to flash buy signals as the market goes lower and lower. I personally believe that these choppy conditions in the market will continue for many months and possibly years to come and thus these oversold/overbought strategies will continue to be effective.
It's useful to pay attention to the shape of bottoms and tops in stochastics. For instance, shallow and short bottoms tend to be very bullish, in contrast to deep and wide bottoms which tend to be more bearish. The opposite also tends to be true in stochastic tops.
Another powerful tool when it comes to stochastics is to watch for divergences between this indicator and the underlying security. An effective way to trade a bearish divergence is to watch for price to reach a new high and for stochastics to have a lower high than it did in its latest rally.
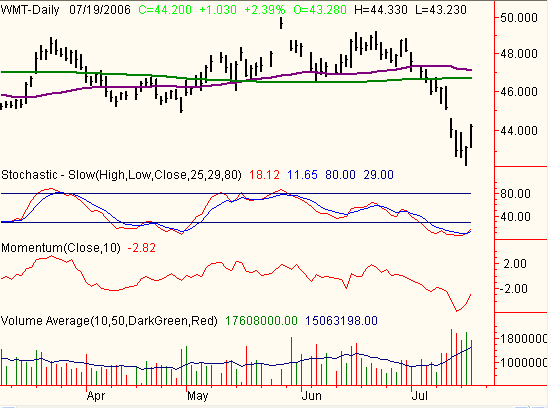
Let's take a look at Wal-Mart. As you can see in the chart below, the %K(red) just crossed over %D while in the oversold territory. The stock itself has made a couple of strong higher highs and although the stock is in an intermediate bear trend, Wal- Mart looks bullish to me. Also worth taking note is the bullish swing in momentum and the recent high volume at what may be a reversal point.

In conclusion, get to know your indicators very well. It will help prevent time wasting and if you understand the logic and effectiveness of several good indicators, you can create your own based on effective pieces of several indicators.
Price Headley is the founder and chief analyst of BigTrends.com.