NASDAQ Commentary
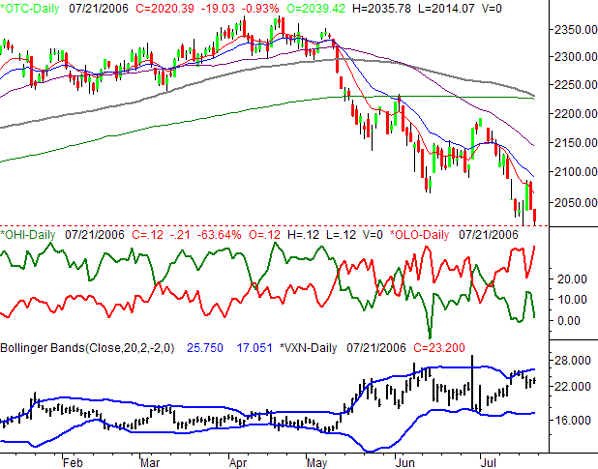
The NASDAQ closed at 2020.39 on Friday, 16.96 points lower the prior week's close. That 0.83% dip paled in comparison to the 4% plunge the week before, but it's still a loss, with some negative momentum behind it. Along the way (as if it wasn't bearish enough already), the composite hit new lows for the year. However, that new low made on Tuesday at least held as support on Friday. And despite all the bearishness, we're still seeing the extreme sentiment readings that are associated with a short-term bottom.
In Wednesday's Midweek Update, we took a look at how unusually high levels of new NYSE highs and new NYSE lows usually indicated the end of a strong trend, and a reversal in the other direction. The basic idea is that a trend ends with one final hurrah, then turns in the other direction - since there are no other market participants left to resist that reversal move (presumably, all of them already took their action). The same idea is applicable to the NASDAQ's new highs and lows. We've plotted them in the middle of the chart (highs = green, lows = red). Back on June 13, we saw 237 new NASDAQ lows. The next day, we saw only 5 new NASDAQ highs. Both, as the chart shows, were extreme readings. Sure enough, we saw a monster rally the day after that, and then a pretty decent upward move over the next few days.
Well, as we can see again now, the last few days have been very unusual in terms high/low readings for NASDAQ stocks. That's the extreme sentiment that keeps us thinking the bulls really do a have a legitimate shot at a rally now.
On the other hand, the trend is still the trend. There's no doubt the trend is currently bearish, and we have to respect that. Plus, Wednesday's big rally and then Thursday's big reversal (which matched Wednesday's bar almost perfectly) constitutes a long-tail reversal, which are pretty good indications of where the pressure really is. In this case, the two-bar reversal was a bearish one.
So, we remain somewhat at odds. From here we'll say wait for the support around 2013 to break before jumping into any new bearish trades, as the extreme sentiment is still potentially able to snap the market back into bullish mode. But, until that time comes, we have to assume the trend will continue in its current direction.
NASDAQ Chart

S&P 500 Commentary
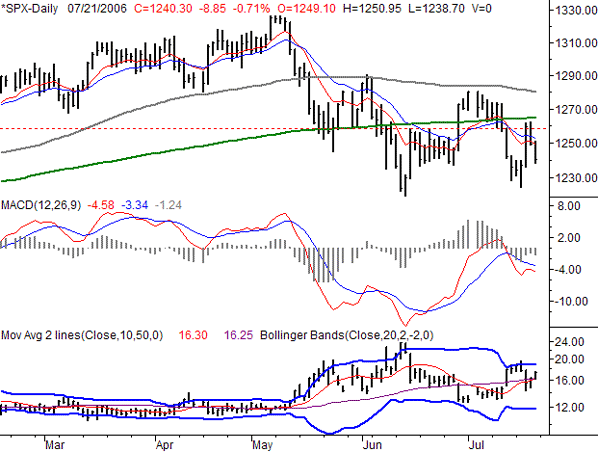
The S&P 500, despite a rough Thursday and Friday, still managed to gain 0.33% last week. The close at 1230.40 was 4.10 points above the prior week's closing level. But, even though the index squeezed out a small gain, like the NASDAQ, the bears still generally have the edge on the SPX. True, the potential for a bounce exists for the large cap index as well, but if you're playing the odds (and we are), then the odds still technically favor more downside.
The ultimate question is do you want to let one day's worth of rally overshadow everything else that happened this past week. Our answer (although maybe not the ultimate answer) is, no. Had it not been for Wednesday's huge 23 point rally, the S&P 500 would have ended well in the red for the week. Fortunately, we have a few other tools that reminded us the index is still struggling to move higher, although there seems to be little problem pushing the SPX lower.
The technical problems for the S&P 500 are numerous. Just to name a few, it's back under the 10- and 20-day lines, after basically meeting resistance at the 200 day line (green) in the middle of last week. Plus, we're in the wake of a bearish MACD crossunder.
More than anything, though, the CBOE Volatility Index (VIX) is trending higher. We thought the VIX might find resistance around 15, but last week, the theory was proven wrong. Instead, the VIX pushed to 19 where it encountered the upper band. We thought the upper band line might send the VIX lower too, but again, it wasn't to be. After an initial dip, the VIX is working its way higher again.
One of the bigger picture VIX signals we're concerned about is the 10-day line (red) crossing above the VIX's 50-day line (purple). This has traditionally been an omen of more selling to come, as we saw in May, for example. Things can and do get stopped before they really get started, but we have to side with the indicators in a straight-forward way until it's clear we shouldn't. At this point, it looks like the VIX's moving average crossover is rather telling.
S&P 500 Chart

Price Headley is the founder and chief analyst of BigTrends.com.