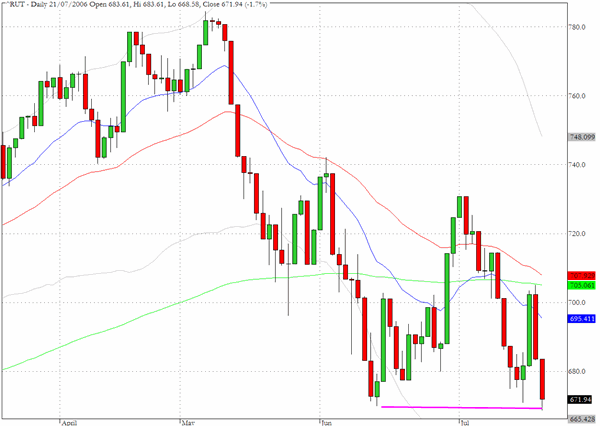
The Russell 2000 concluded last week with back to back declines that took the index down in two sessions by 4.5% from its close right at the 200-day EMA level of of 702 on Wednesday to 671 on Friday. The intraday low on Friday pierced below the mid June lows and came within a whisker of the lowest intraday value recorded in 2006 which was 666 on the first trading day of the year.
Asset managers are selling many tech stocks indiscrimately and there is a growing uneasiness about the economic prospects for 2007 which threatens to pull the plug on the small cap rally which has inspired much of the positive market internals for the last three years.
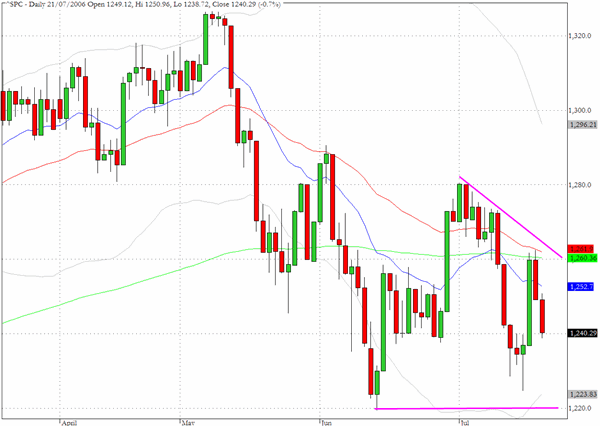
Over the last two sessions the S&P 500 dropped back 1.5% from 1260 (its 200 day EMA level) as compared to the 4.5% drop for the Russell 2000. As the chart reveals Friday's close lies at the mid point betwen the overhead resistance at 1260 and the June lows near 1220. We remain above Wednesday's low which cannot be claimed for the Nasdaq indices and the Russell 2000.
Almost ten percent of the 500 most liquid stocks that we scan daily closed Friday's session with losses of five percent or more. Amongst the biggest losers were PMCS(26%), AMD (16%), BRCM (12%), DELL (10%), COF(10%), HAL(8%), MRVL(8%) and NVDA (8%). Clearly Dell's gloomy outlook was a major contributor to the weakness amongst the semiconductors and PC related stocks but even favorites such as HANS registed a five percent decline.
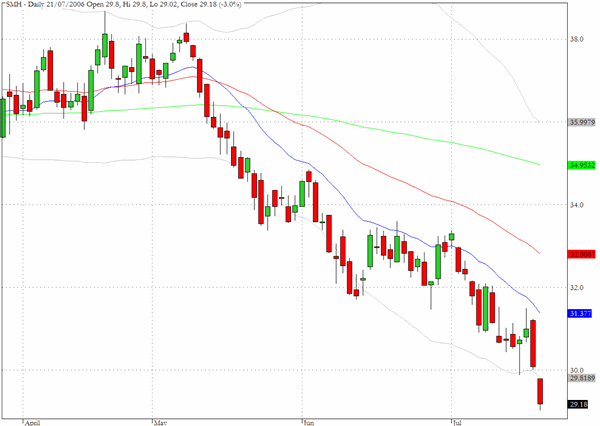
The semiconductor sector fund SMH continues to erode and lost a further 3% on Friday. We have to go back to September 2004 for a lower close.
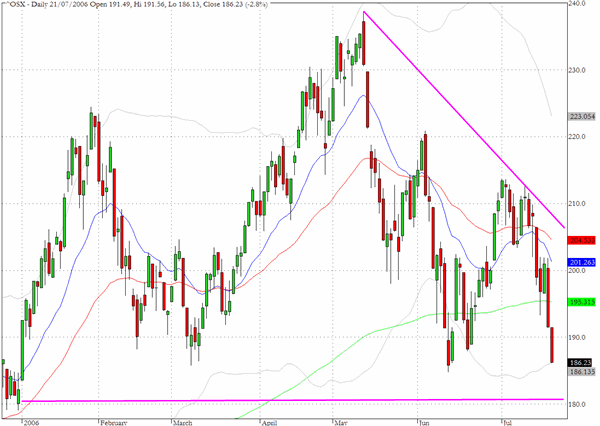
The index for the oil services sector (^OSX) has retraced all of the progess that it had previously made since the beginning of 2006. The index is down more than 30% from its peak in May and with techs under fire and previous institutional favorites such as VLO and RIG now in steady decline sector rotation strategies by major asset managers are getting that much harder to implement.
TRADE OPPORTUNITIES/SETUPS FOR MONDAY JULY 24, 2006
The patterns identified below should be considered as indicative of eventual price direction in forthcoming trading sessions. None of these setups should be seen as specifically opportune for the current trading session.
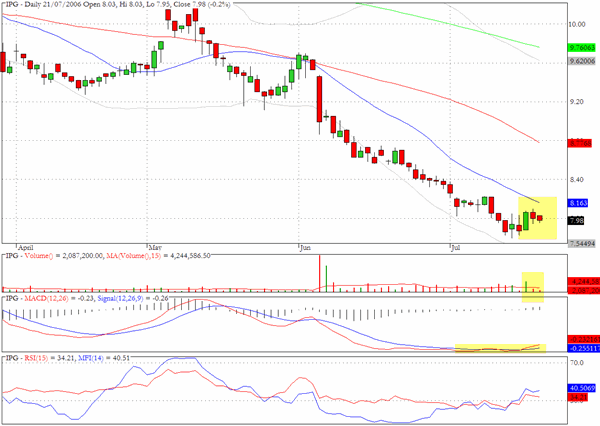
As we cautioned on Friday this is a difficult market to trade and our suggestions should be considered with that caveat in mind. IPG has some positive divergences and should make upward progess in coming sessions.
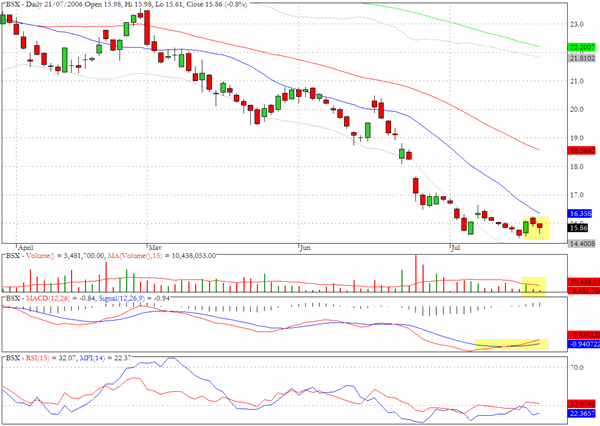
Similar reasoning applies to Boston Scientific (BSX).
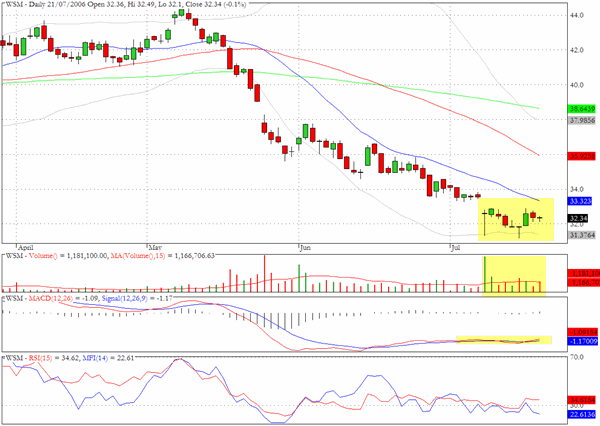
Yet another chart that has interesting volume and MACD characteristics is for Williams Sonoma (WSM).
On the short side Frontline appears to be struggling after recording a lower high and the tiny Doji could be the precursor to a range expansion session.

OSI Pharmaceuticals (OSIP) closed right on the 200-day EMA but the volume and momentum are poor and the heavy volume session that we have highlighted shows that there could be some more selling to be done.

Clive Corcoran is the publisher of TradeWithForm.com, which provides daily analysis and commentary on the US stock market. He specializes in market neutral investing and and is currently working on a book about the benefits of trading with long/short strategies, which is scheduled for publication later this year.
Disclaimer
The purpose of this article is to offer you the chance to review the trading methodology, risk reduction strategies and portfolio construction techniques described at tradewithform.com. There is no guarantee that the trading strategies advocated will be profitable. Moreover, there is a risk that following these strategies will lead to loss of capital. Past results are no guarante of future results. Trading stocks and CFD's can yield large rewards, but also has large potential risks. Trading with leverage can be especially risky. You should be fully aware of the risks of trading in the capital markets. You are strongly advised not to trade with capital.