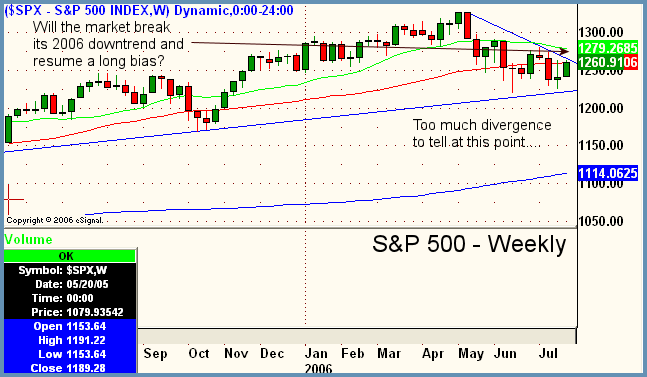
Good Morning, Traders. Crazy volatility as of late. On no economic data and some M&A activity news, stocks took off again and the Dow registered almost another 200-point day. With such swings back and forth, it's difficult to pinpoint near-term bias any closer than "sideways." In a race back to the highs of four days ago, the S&P put on 20.62 and the Nasdaq added 41.45 on top of the Dow's aforementioned run of +182.67. What does it all mean? Hard to say at this point when everything is so divergent. Breadth was great yesterday, but overall the volume was down by 22% (!) on both exchanges. Homebuilders (short covering) and energy stocks topped the my Core Sector List while Semiconductors remained low on the totem pole. Interestingly enough, pull up a chart of the $SOX on any intraday timeframe (15 minute is our personal fave...) and overlay with the S&P 500. What's that all about? It's the most beaten down sector as of late and when the broad market made its second major advance of the day to fresh intraday highs (late afternoon from 2:15 pm to close), the Semiconductor Index closed over 3 points shy of its morning highs. In the chart below, the S&P (weekly) actually looks like it may break trend and resume upward momentum, while the Nasdaq as we know is so far below the weekly trendline that any rallies to here would certainly be met with major resistance in the near term. So, mixed signals are abounding for the present. We have been saying all along that we will be ready to shift our overall bias if the trend was to show some meaningful (on increases in overall volume) changes. Market remains sideways to down and very news driven. Be careful out there. Remember, when the bias is unclear, it's always a good idea to either completely suspend swing/position trading operations temporarily, or cut down in size.

Focus List

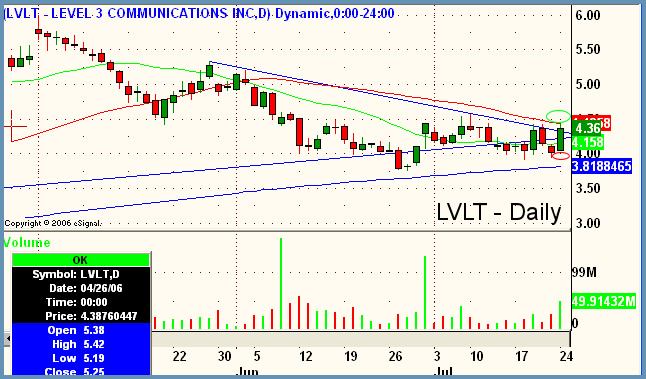
LVLT - Level 3 Communications
Industry - Telecommunications
Side - Long
Trigger - 4.49
Stop - 4.00 or low of daily breakout bar
Target - 45.00+
Timeframe - multiweek to multimonth
Notes
- Just starting to peek above a recent downtrendline on good volume increase yesterday
- Cheaper stocks are sometimes easier to get moving when the market is not breaking out to new highs
- Using bullish candle of 7/24 for entry and stop parameters

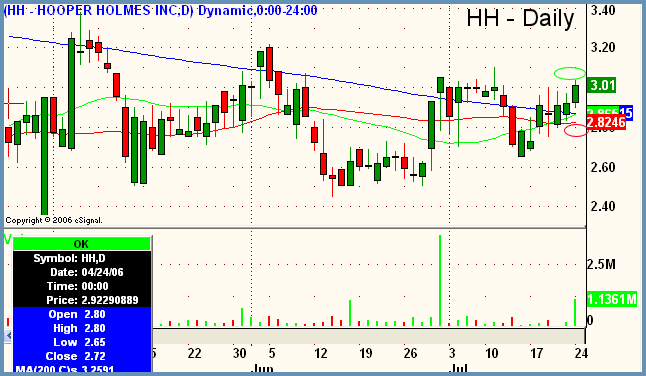
HH - Hooper Holmes Incorporated
Industry - Health Services
Side - Long
Trigger - 3.10
Stop - 2.80
Target - 4.00
Timeframe - multiweek to multimonth
Notes
- If entering for first time, setup is still valid, with tighter stop now
- Low priced issues tend to have a good amount of volatility when examined on a % of price; size accordingly
- Consider adding to position over recent swing highs if advance occurs
Peter Reznicek is the Chief Equity Strategist and a principal of the Prana Fund, a domestic hedge fund, and ShadowTrader, a subsidiary of thinkorswim which provides coaching and education to its clients on both intraday and swing trading of equities. For a free trial to the full version of The Big Picture or to learn about ShadowTrader's other services, visit shadowtrader.net or send an email to preznicek@shadowtrader.net.