As we've said many times, the monthly indicator suggests biases for holding longs and shorts according to proscribed dates. It's clearly a broad numbers game. Sometimes it works spectacularly, sometimes just the opposite. Often we find ourselves in more moderate middle ground.
There does seem to be a pull throughout the month, however, that says, “Buy now! If I'm wrong today, try tomorrow!” Every day, after all, shares the bias.
That's why, perhaps not surprisingly, you do get good results following days that go against the script. Specifically, if you're in the buy time, and yesterday's close was less than the open, buy today on the open and exit on the close. Shorts would follow higher open-to-closes in the sell time frames.
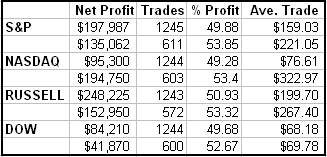
Figure 1 shows the results. The top rows show the outcome of entering each day according to the monthly indicator and the second row show what today's filter produces. As you can see, there is a significant near-across-the-board improvement in profit per trade.

The Biases
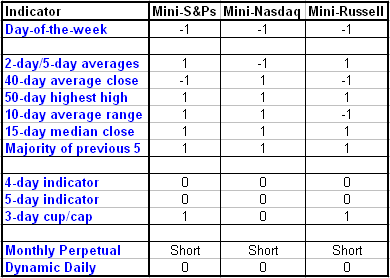
Switch from long to short in the mini Nasdaq. Hold exiting shorts in the mini S&Ps and Russell.
The bottom two rows determine the signal. Dynamic Day One trumps everythingâ€"you always follow it. When it's neutral, the Monthly Perpetual provides the direction. Click here for a more in-depth explanation of the rules.

DISCLAIMER: It should not be assumed that the methods, techniques, or indicators presented on in this column will be profitable or that they will not result in losses. Past results are not necessarily indicative of future results. Examples presented on this column are for educational purposes only. These set-ups are not solicitations of any order to buy or sell. The author, Tiger Shark Publishing LLC, and all affiliates assume no responsibility for your trading results. There is a high degree of risk in trading.
Art Collins is the author of Market Beaters, a collection of interviews with renowned mechanical traders. He is currently working on a second volume. E-mail Art at artcollins@ameritech.net.