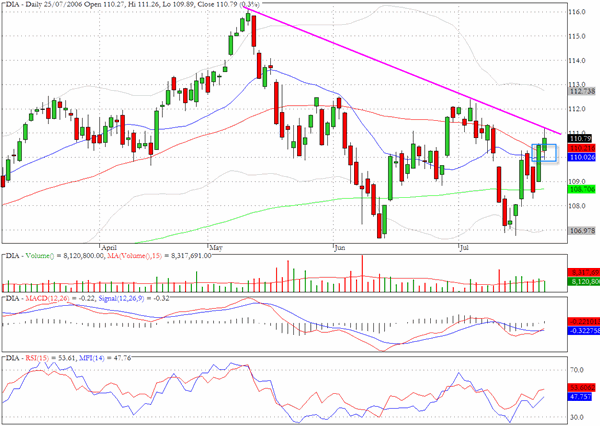
The Dow Jones Industrials proxy DIA closed at 110.79 up 0.6% on the day mirroring the close of 11,103 on the cash index. We have drawn a line through the intraday high from May 10 to the intraday high on July 6, and as can be seen on the chart yesterday's high touched this line exactly. The constructive action of the last few sessions suggests that the early July lows in the vicinity of 11,200 will be targeted but there is a lot of resistance in the region between 11,200 and 11,400 on the cash index and we have not seen a close above 11,300 since May 16.
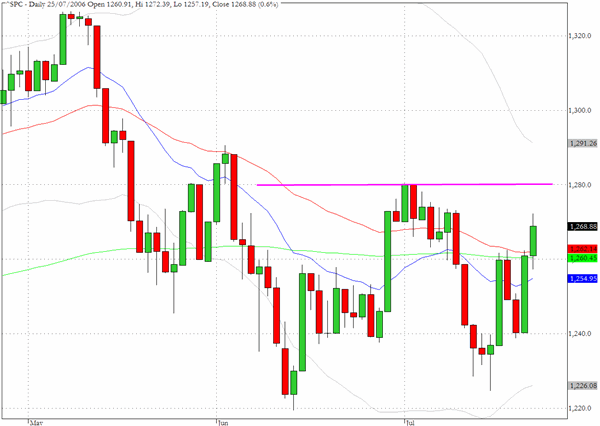
The S&P 500 closed above its 50-day EMA for the first time in ten days yesterday. The close at 1268 also marked the first decisive close above the 200-day EMA in as many days. A further one percent gain will bring the index to 1280 which has proven to be a major resistance level since mid May.
The consumer discretionary sector fund XLY faces two key challenges. The first is at $32.40 which is just above yesterday√Ę‚,¨‚"Ęs close and which represented the breakdown point from July 13. The second level at $33 which we have indicated on the chart may prove more formidable as it coincides with the 200-day EMA and the trendline through the highs.

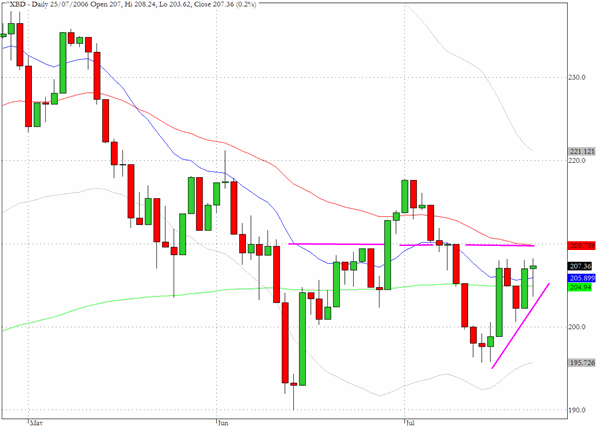
The broker/dealer sector (^XBD) is moving further into a wedge pattern and the closes in four of the last five sessions have all been just above the 208 level. As with so many of the charts the index seems to be stalling as it contemplates a break above the trend line through the highs. This sector was one of the first to show weakness in mid April anticipating the broader market's May sell off and it would be worth monitoring the sector again to see how it deals with the possible break above the trendline
TRADE OPPORTUNITIES/SETUPS FOR WEDNESDAY JULY 26, 2006
The patterns identified below should be considered as indicative of eventual price direction in forthcoming trading sessions. None of these setups should be seen as specifically opportune for the current trading session.
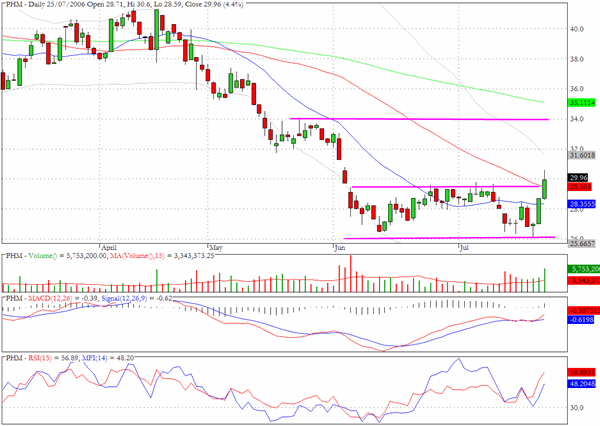
Pulte Homes (PHM) appears to have broken above the horizontal channel that had confined it since early June. Yesterday's close was just below $30 but the substantial volume encourages the view that $34 is attainable in coming sessions.
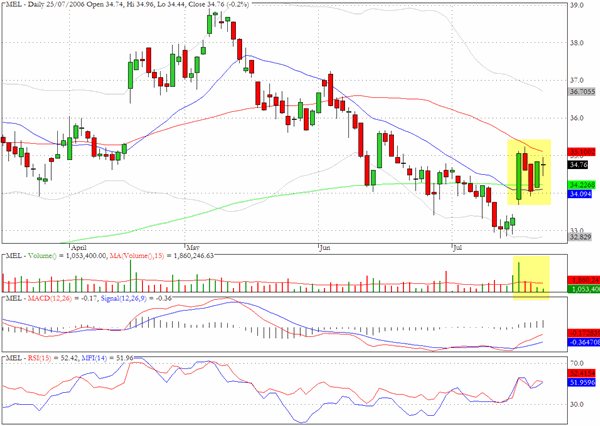
Mellon Financial (MEL) could be close to a break above the flag like formation.
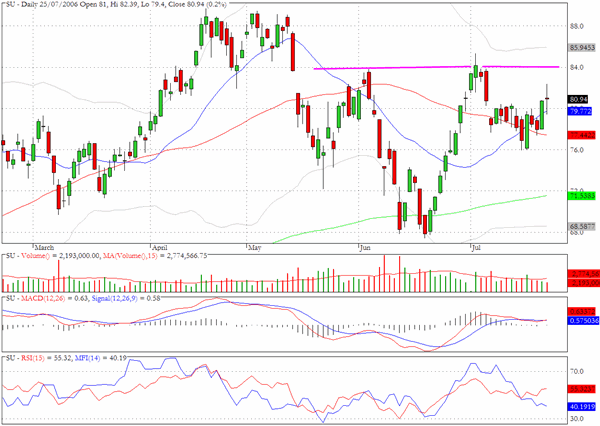
The chart for Suncor (SU) suggests that we may see a spike up towards $84 at which point we would suggest a short position could be an attractive risk/reward proposition.
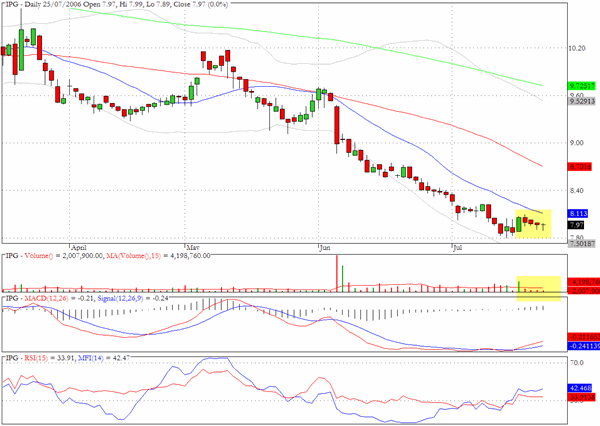
IPG has signs that it could be preparing to move up (at least temporarily) from a basing pattern.
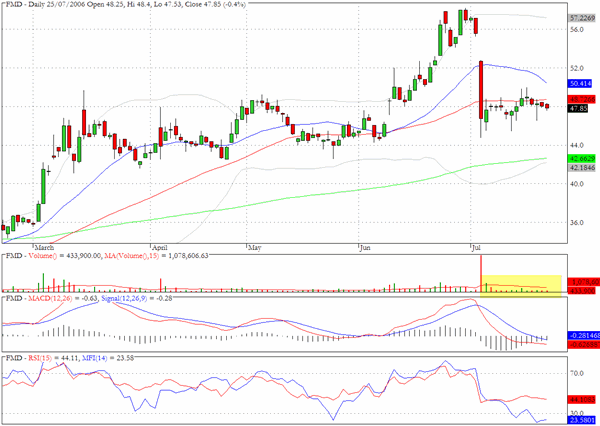
We drew attention to the chart for FMD last week and as the volume chart reveals there seems little enthusiasm behind the extended pullback effort from the severe corrective move that occurred on July 6th. Further weakness is probable.
Clive Corcoran is the publisher of TradeWithForm.com, which provides daily analysis and commentary on the US stock market. He specializes in market neutral investing and and is currently working on a book about the benefits of trading with long/short strategies, which is scheduled for publication later this year.
Disclaimer
The purpose of this article is to offer you the chance to review the trading methodology, risk reduction strategies and portfolio construction techniques described at tradewithform.com. There is no guarantee that the trading strategies advocated will be profitable. Moreover, there is a risk that following these strategies will lead to loss of capital. Past results are no guarante of future results. Trading stocks and CFD's can yield large rewards, but also has large potential risks. Trading with leverage can be especially risky. You should be fully aware of the risks of trading in the capital markets. You are strongly advised not to trade with capital.