Want to know the worst of the worst lately? You may be surprised to hear that the capital goods stocks (also called the basic industrials by some) have turned in the weakest performance of any sector over the last month. Worse than that, they've under-performed pretty consistently over the last several months. Worse still, they don't appear as if that's going to change anytime soon. Let's take a look at the chart and see what may be in store.
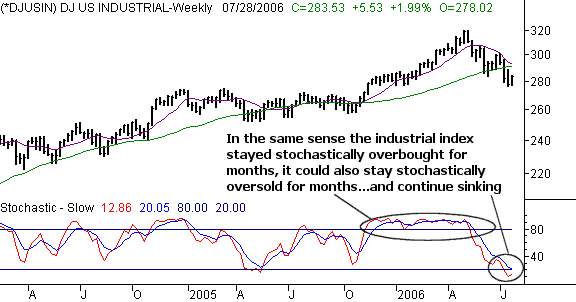
The Dow Jones U.S. Industrial Index (different from the Dow Jones Industrial Index) has been one of the hardest hit indices of the May-to-now decline. After reaching a high of just under 320 in mid-May, it's been little but pain ever since. The current level of 283.5 is 11.4% under that peak high, and that's with the 2% gain it's managed to make this week as of yesterday. Things are back to normal today; the industrials are lagging all other sectors with their 1.5% dip. In this case, we think today's action is a micro-picture of the much bigger picture. Of course, the bigger picture is verifying the same...just look at the chart.
If the overall market turns weak again, we're looking for the industrials to lead the charge lower. Even if the market manages to follow through on this week's early bullishness, the capital goods names still have very little to offer.
No targets and stops this time around, but we will mention that the 50- and 200-day moving averages are both right around 292. If the index manages to move above that level, then the bearish expectation will be negated. (be sure to keep reading below for our take on another industry)
Dow Jones U.S. Industrial Index (DJUSIN) - Weekly

Where the industrial sector is about as mainstream as you can get, many of you may be surprised to even hear that there's a toy index. We've actually looked at the Dow Jones Toy Index before, but it's so obscure, we only want to bother looking at it when there's a really good reason to do so.
Well, there's a really good reason to do so now.
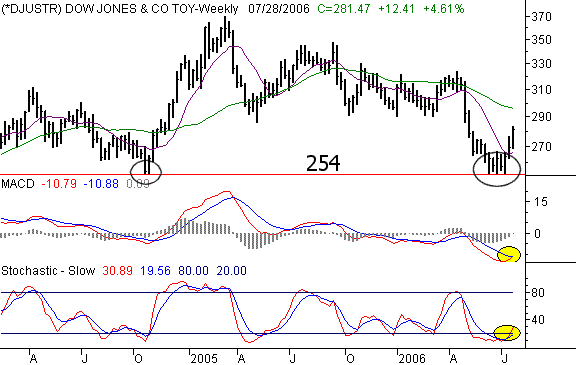
Over the last three weeks, the Dow Jones Toy Index has made a textbook recovery, and pulled itself out of a consolidation mode (which, by the way, occurred after a rather hefty tumble). What we like best is that the reversal was not a one-day wonder. Instead, it was smooth and methodical, and rolling. The implication is just that it has a better chance of sticking, rather than inviting a massive wave of profit-taking, Even more impressive is that the index has managed to make such a move during a period when the overall market really wasn't doing all that well - relative strength is a big deal.
In the meantime, we have technical buy signals form our MACD as well as our stochastic lines, as well as the cross back above the 50-day line. The 200-day average (green) at 296 has the potential to be resistance, so keep a close eye on things once we get there. Assuming we get past that level, we'll set a target of 330.
You think it might be too much movement for a toy index? Look at what happened in late 2004. Even toy-maker stocks can move quickly, once the momentum is in place. Apples to oranges? Nope, not even close. The only reason we even decided to bring it up today was because there were so many parallels between now and late 2004. See the support line at 254, where the index found a base to start its recent consolidation? Trace that line all the way back to 2004. See anything familiar? We're right where we were then - right before the monster move. Somehow, the index's 254 level is a big deal for these stocks. We can't just chalk up the precise support level to coincidence.
As for a stop, obviously any close under 253 would negate this bullish stance. By the way, there is no toy index, fund, or instrument to trade. You'll have to go out and look for individual toy-maker stocks to make this opinion actionable.
Dow Jones Toy Index (DJUSTR) - Weekly

Price Headley is the founder and chief analyst of BigTrends.com.