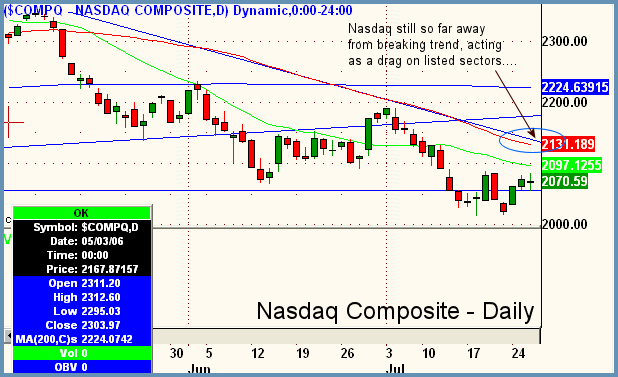
Good Morning, Traders. Choppy day in the markets yesterday as a morning decline gained strength over lunch and closed positive. Negative news from Internet stalwart Amazon.com (AMZN) kept the $GIN (Goldman Sachs Internet Index) underwater by almost 2% from its open, while energy-related sectors flourished after the 10:30 am Crude Inventory report from the Department of Energy. When the smoke cleared, all three major averages closed very close to where they ended up at the end of trade on Tuesday on mixed internals. Breadth closed positive on both exchanges but only by a hair. Similarly, advance-decline lines were relatively flat as well. In the chart of the daily Nasdaq below, we can see the relative weakness that is keeping this market from being anywhere near the trendline that defines its current bias. In a nutshell, it is more than likely this divergence that is holding the S&P and Dow back from breaking their respective downtrend lines on the dailies. When tech keeps getting beaten up day after day, it acts as a drag on the listed names and a tug of war of the sort that we had yesterday ensues. Bias remains sideways in the near term with emphasis on the divergence between the S&P/Dow and the Nasdaq, and the fact that we remain waist deep in the middle of a very heavy flow of earnings reports. Initial claims (unemployment) and new home sales figures are slated for release this morning, which could shake things up a bit.

Focus List

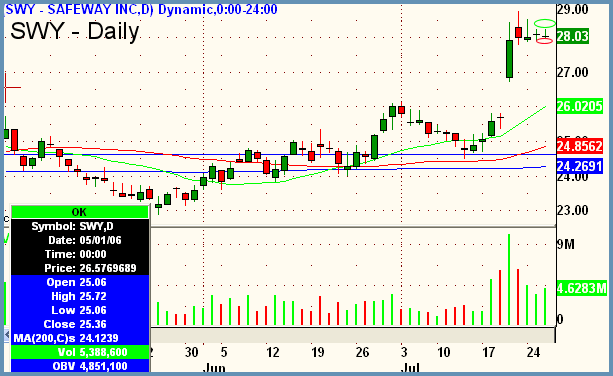
SWY - Safeway Incorporated
Industry - Retail (Grocery)
Side - Long
Trigger - 28.30
Stop - 27.85
Target - 30.00+
Timeframe - multiweek to multimonth
Notes
- Pull up monthlies (not shown) to see lack of resistance above for this issue
- Volume on gap confirming and holding so far
- Using inside bar doji of 7/25 for entry and stop parameters
- Originally listed in Focus List of 7/25. The two dojis in a row now indicate further contraction of volatility which should expand to upside if the pivot is breached

WBSN - Websense, Inc.
Industry - Internet
Side - Short
Trigger - 18.25 / 17.80
Stop - 19.05
Target - 15.00
Timeframe - multiweek
Notes
- Stock has already been in a downtrend for some time now but longer term charts show more room to downside
- Earnings came out on 7/25 and except for a quick, knee-jerk reaction to upside, sellers remained in control
- Weekly chart (not shown) is showing two inverted hammers forming under resistance of 200ma
- Two entries listed, consider scaling into position; first under 7/26 low and then more under swing lows
- Stop over 20ma daily (green)
Peter Reznicek is the Chief Equity Strategist and a principal of the Prana Fund, a domestic hedge fund, and ShadowTrader, a subsidiary of thinkorswim which provides coaching and education to its clients on both intraday and swing trading of equities. For a free trial to the full version of The Big Picture or to learn about ShadowTrader's other services, visit shadowtrader.net or send an email to preznicek@shadowtrader.net.