NASDAQ Commentary
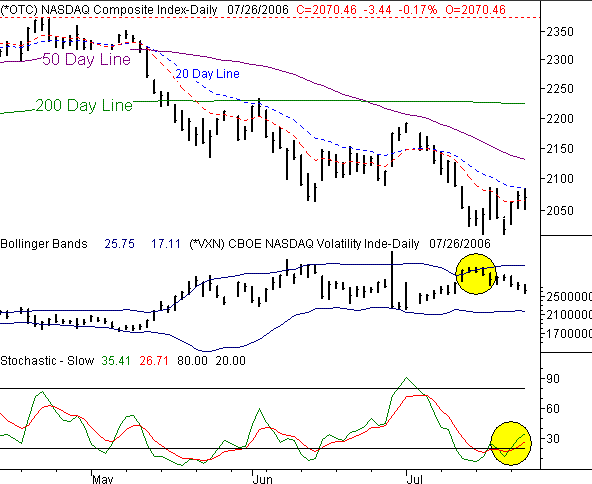
The NASDAQ looked like it might make it three in a row on Wednesday, after reaching a slightly higher high than Tuesday's peak of 2080.11. But, it wasn't to be. Instead, the composite closed at 2070.46 on Wednesday afternoon, 3.4 points lower (-0.17%) than where it ended on Tuesday. But still, for the week, the NASDAQ is up by 50 points, or 2.5%. The problem is, the bulls are again running into some familiar problems.
What's technically bullish? The falling NASDAQ Volatility Index (VXN) for one thing. When it bumped into the upper 20-day Bollinger band a couple weeks ago then stalled, it was a correct indication of at least a short-term bottom. The VXN started to fall back from highs around 25.40 all the way back to yesterday's close of 20.69. So, as far as the VXN trend is concerned, what's bad for the VXN is good for the market. Even more than that, the lower Bollinger band is just at 17.11, which leaves plenty of room for the VXN to keep falling before we're threatened with support and a reversal.
On top of that, the stochastic buy signal we saw in the making has indeed come to fruition...both of the stochastic lines are now back above 20.
Yet, we can't escape that nagging resistance at the 20 day moving average line (blue, dashed). With the exception of an all-too brief five-day stretch in late June/early July, the composite has been held down by the 20 day line, with yesterday's high serving as a stark reminder of that reality. On top of that, a secondary resistance line (not shown) has appeared this week - around 2084. That's where we topped out yesterday, and Wednesday and Thursday of last week (and effectively Tuesday of this week). Despite the mostly-bullish VXN and stochastic chart, we're still hesitant - and even slightly bearish - until these persistent resistance problems can be overcome.
(And let's not even get started on the 50-day line at 2130.)
NASDAQ Chart

S&P 500 Commentary
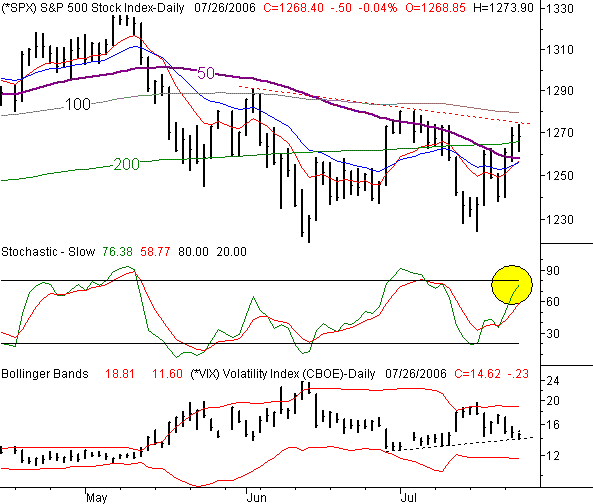
On Wednesday, the S&P 500 closed only 0.5 points under Tuesday's close, which is close enough for us to call a breakeven. So for the week, the large-cap index is ahead by 2.27%, or 28.1 points. However, the close at 1268.40 and Wednesday's week high of 1273.90 are both a glaring reminder that once again, the market rally is being shut down without every really getting a chance to get going. This time, a short-term resistance line is the culprit.
OK, to give credit where credit is due, the SPX has done significantly better than the NASDAQ. In fact, the S&P 500 is back above all of its key moving averages except one - the 100 day line, at 1279. So, from a technical (moving average crossover) perspective, the S&P chart is bullish. However, this chart also faces a couple of near-term problems that could spell out a quick end to the recent strength.
First, note how an intermediate-term resistance line (red, dashed) came into play yesterday, stopping the uptrend dead in its tracks and sending the chart back to where it started. Second, take a look at the stochastic chart. Or more specifically, take a look at how close we are to seeing both stochastic lines hitting the oversold (80) threshold. IN some environments, becoming 'overbought' can indicate a strong bullish uptrend is in place...if the index stays overbought. However, we're not in that kind of environment right now - at least not as far as recent history indicates. The 'overbought' situations in May and June all led to strong pullbacks.
Lastly, although not least, the S&P 500 Volatility Index (VIX) looks like it may be finding support from a short-term support line (dashed). If that's the case, and the VIX pushed up and off that line, stocks should fall accordingly. There is, of course, a caveat with the VIX...the lower Bollinger band is a much better (i.e. more likely) support level. It's currently at 11.60, or 3 points under yesterday's VIX close at 14.62. If the VIX is allowed to break under that short-term support line and fall to the lower band line instead, that may buy enough time for the S&P 500 to work its way back above the 100 day line. And if that happens, it would go miles and miles in restoring confidence for the bulls again...which of course would drive stocks significantly higher (and out of their current rut).
S&P 500 Chart

Dow Jones Industrial Average Commentary
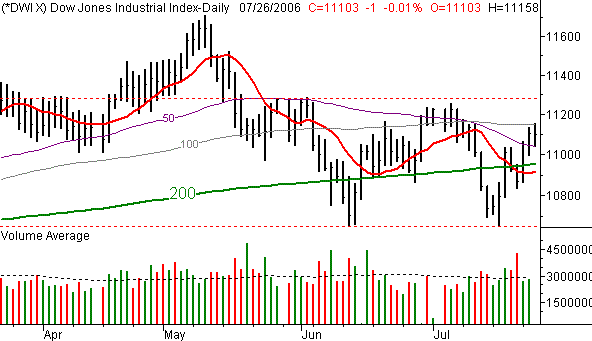
The Dow Jones Industrial Average lost 1 point on Wednesday, which is about as close to even as you can get without actually being even. The close of 11,103 is 235 points higher (+2.16%) than where the blue-chip index left of on Friday. But, like all the indices on Wednesday, the Dow ran into problems its been facing for a while. Until those hurdles can be cleared, any bullishness (like Monday's and Tuesday's) is going to be tainted.
Note that the 100 day line was resistance yesterday, although the Dow has managed to get back above all the other key moving averages. What's concerning, however, is the lack of bullish volume behind the gains we've seen lately...most of the volume has been bearish, which isn't exactly the right platform from which a rally will be launched. Plus, it's clear now that the industrial average is range-bound between 10,650 and 11,280. So, even if the 100 day line is broken, we can't rely on any bullishness until the Dow breaks out of this sideways zone. That, however, may at least set up a couple of 'trades' for anyone willing to play the ping-pong nature of this chart.
Dow Jones Industrial Average Chart

Price Headley is the founder and chief analyst of BigTrends.com.