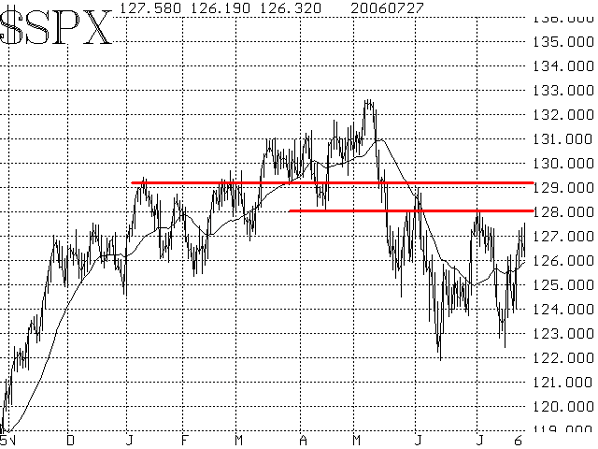
There is enough action on both sides of this market to justify either a bearish or bullish case. The big rally that occurred this week broke through the first $SPX resistance area at 1260, and that was positive. However, the real resistance on $SPX is at 1280 and 1290 -- the tops of the previous rallies. If the market could punch through there, it would be quite positive, but we don't think it can.
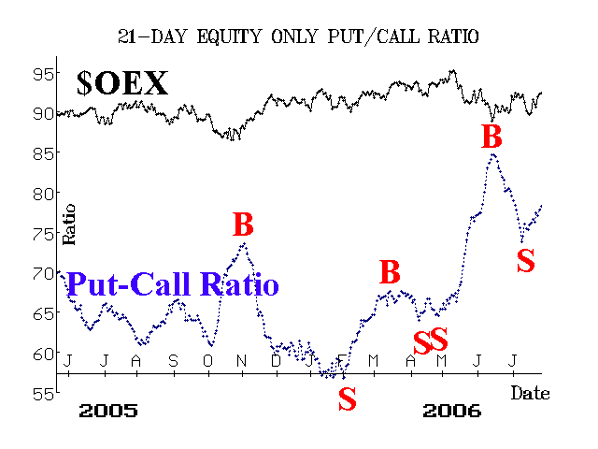
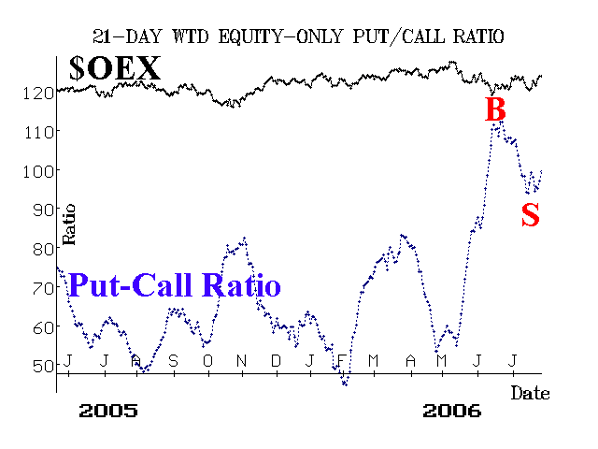
Equity-only put-call ratios have somewhat surprisingly thrown a damper on our set of technical indicators. First the standard ratio gave a sell signal, and now the weighted ratio has just recently followed suit. Admittedly, they are at rather high levels on their charts (Figures 2 and 3), so perhaps another buy signal is not far off. But, for now, they have turned bearish. Since they are such good intermediate-term indicators, we have to respect them. While we're on this subject, NASD stocks have been in such a sorry state that they never gave the buy signals that the other equity-only ratios did (in mid-June). Now, all the others have rejoined the NASD ratio on a sell.


Market breadth (advances minus declines) continues its schizophrenic activity. It ranges from wildly bullish to wildly bearish on back-to-back days. What causes this is the uniformity of institutional activity during a single trading day. They all come in to either buy or sell and demand fills by the end of the day. Then, the next day is a completely new story, with new rumors or news, and a whole other set of lemming-like institutional trading activity. As a result, breadth continues to be a weak indicator.
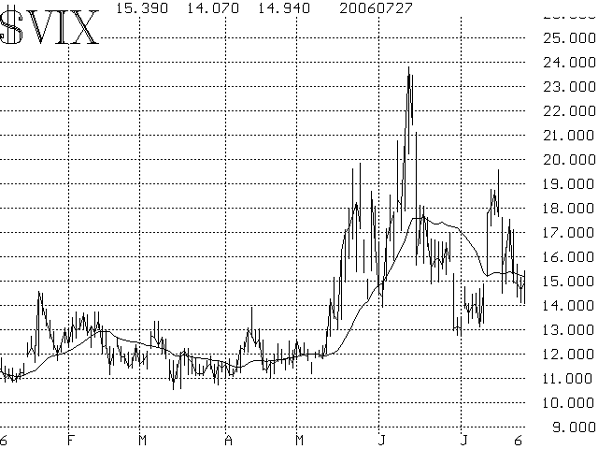
Volatility indices ($VIX and $VXO) are on buy signals as well. They peaked a couple of weeks ago and have generally been trending lower ever since. A down-trending $VIX is bullish.

So, we have somewhat mixed indicators, with $SPX, $DJX, and $OEX bumping up against heavy overhead resistance -- including their 100-day moving averages, which managed to stem every rally so far (QQQQ is in far worse shape than these other indices). While we allow for the possibility of a rally towards $SPX 1280-1290, we expect that resistance to hold and lower prices to be seen soon.
Lawrence G. McMillan is the author of two best selling books on options, including Options as a Strategic Investment, recognized as essential resources for any serious option trader's library.