Good Morning, Traders. Recent action in the S&P has been rather "messy", with many large advances and declines. The three major moving averages (20, 50, 200) that we watch are telling us very little about near-term trend as all three are converging and sideways. Friday's bullish action and subsequent close near the 1280 pivot has completed an interesting pattern that may be setting us up for a move to the upside this week. Like with any chart, it helps to dissect it from the perspective of the market players. That is those who are long and those short, and put some weight into what the candles and pivots mean to each particular group of market participants. Let's begin.
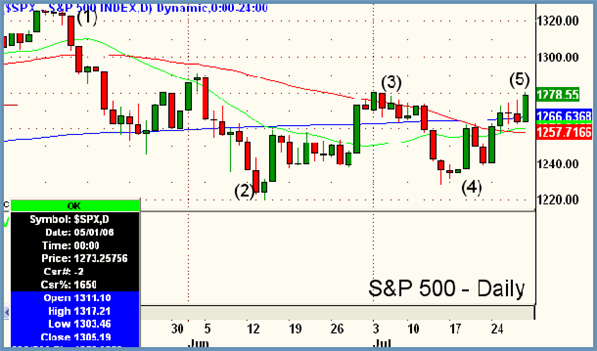
In the daily chart of the S&P 500, we have labeled some key points over the last three months. Point 1 at the top left of the chart is the high of the year for the S&P, which was established on May 8, 2006. Since then, the market had a steady decline which created a low for the year at point (2) which was 1219.29 on June 14. So far, from point (1) to (2), itâ�,��"�s pretty easy to figure out bias and establish that bears are in control. From this point on, it becomes a bit less clear. After the low at (2) the market rallied to point (3). If we look to the left of point (3) to see where the prior swing high was in the first few days of June, we see that point (3) did not move over this area, so the downtrend from mid-May is still in place. The ensuing sell-off from point (3) downward, resulted in a bottom at point (4), established at 1224.54 on July 18. Here's where things start to get interesting and we need to pay closer attention. First note that the low of (4) is very close to but slightly higher than the low at (2). This makes it a "double bottom" which in itself is a technical pattern that indicates strong support in a given area. Some technicians would note that the fact that point (4) is slightly higher than (2) creates a rather imperfect double bottom, which is considered slightly more bullish. This makes sense because as stated earlier if we understand that all chart patterns are simply a graphical representation of market psychology, then the bulls at point (4) showed their strength (and impatience) by stepping up before prices reached the earlier 1219 pivot. After this double bottom low at point (4), we have since rallied to present day which we have annotated (5). The first important thing to notice about where price has currently stopped is how close it is to the last swing high at (3). We know what happened last time at point (3) when bulls could not push prices higher than the previous swing high of June 2. This time we have not breached our prior swing high (3) either but we are parked right at it with a big body bullish bar that lies in the bulls favor. So going forward and knowing that the last low (4) was an imperfect double bottom (in favor of bulls), which as rallied us right up to the last prior swing high (3), it would follow that a breach this week of (3) and (5) should lead to a swing higher. It would be thus for two major reasons. The first being that it would collectively confirm the actions of all of the bulls who stepped up at point (4) and the second would be that it would collectively deny all of the actions of the bears who stepped up at point (3). For now, prices having not breached that prior swing high at point (3), the bears can still consider themselves "right" and do not need to reverse their positions to avoid pain. Bulls, while enjoying some gains and feeling "right" if in from point (4) have not yet been able to rally over point three which would invalidate the prior swing high and change trend. Although the amount of mixed signals out there with the weak Nasdaq and political unrest in the middle east would cause us to tread lighter than usual, from a purely technical perspective it makes sense to look at longs at least on a short-term basis if July highs in the S&P get taken out at (3) and (5).

Focus List

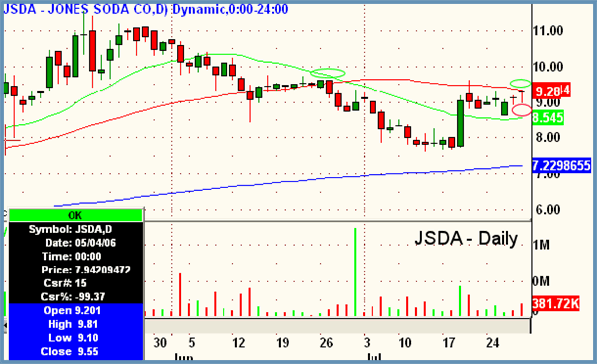
JDSA - Jones Soda Company
Industry - Beverages
Side - Long
Trigger - 9.35 / 9.76
Stop - 8.85
Target - 11.55+
Timeframe - multi-week
Notes
- Check weeklies (not shown) to see much more intact bullish pattern
- Recent action indicates support in this area. A break above highs of mid June ($9.71) would further confirm it
- Consider scaling with two entries and honoring the one stop listed for both
- Target listed is to prior swing highs

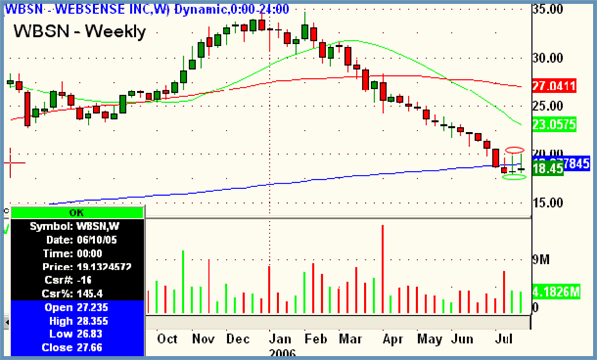
WBSN - Websense, Inc.
Industry - Internet
Side - Short
Trigger - 18.25 / 17.80
Stop - 19.05
Target - 15.00
Timeframe - multi-week
Notes
- Stock has already been in a downtrend for some time now but longer term charts show more room to downside
- Earnings came out on 7/25 and except for a quick, knee-jerk reaction to upside, sellers remained in control
- Weekly chart (not shown) is showing two inverted hammers forming under resistance of 200ma
- Two entries listed, consider scaling into position; first under 7/26 low and then more under swing lows
- Stop over 20ma daily (green)

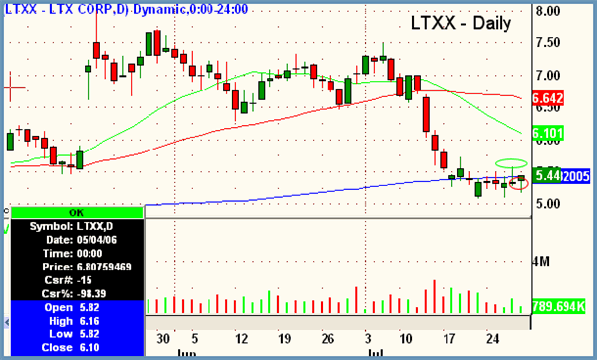
LTXX - LTX Corporation
Industry - Semiconductor
Side - Long
Trigger - 5.63
Stop - 5.30
Target - 6.00+
Timeframe - 3 days to 2 weeks
Notes
- $SOX index looks poised to snap a multi-month downtrend.
- The "straight line" decline in LTXX from mid June to present will offer no resistance if a rally ensues into its area
- 200ma (blue) support at current levels
Peter Reznicek is the Chief Equity Strategist and a principal of the Prana Fund, a domestic hedge fund, and ShadowTrader, a subsidiary of thinkorswim which provides coaching and education to its clients on both intraday and swing trading of equities. For a free trial to the full version of The Big Picture or to learn about ShadowTrader's other services, visit shadowtrader.net or send an email to preznicek@shadowtrader.net.