NASDAQ Commentary
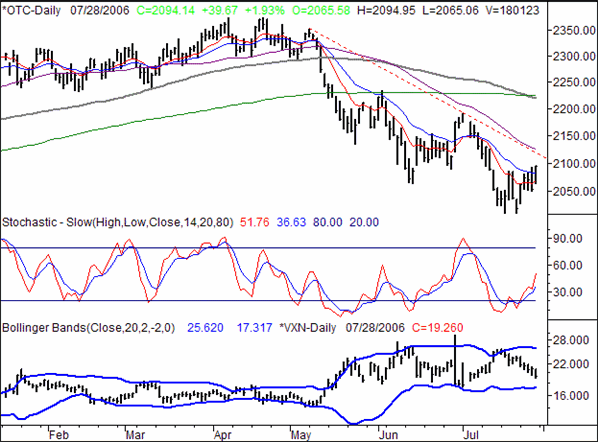
The 1.9% gain the NASDAQ Composite made on Friday pushed the index up to a weekly close of 2094.14. That brought the grand-total weekly gain to an improvement of 73.75 points (+3.65%), a stark turnaround from the prior three weeks. While there's even a little more room for upside movement in the bigger picture (and even the not-so-big picture), the composite isn't really being tested yet. As for what may happen once the index is tested, we're still leaning on the bearish side of things.
Most of our analysis is reserved for the Dow and the S&P 500 this week, but we do have a quick note on the NASDAQ.
First - although not foremost - don't read too much into the NASDAQ's rally last week. It had plenty of room and reason to bounce. The fact of the matter is that the composite isn't even being tested yet. Resistance is at 2110 (red, dashed) and falling every day. So, the index could even move a little higher, and still be in a downtrend. Don't jump the gun.
The rest of the market's story is actually best told with the other indices this week. So, read on.
NASDAQ Chart

S&P 500 Commentary
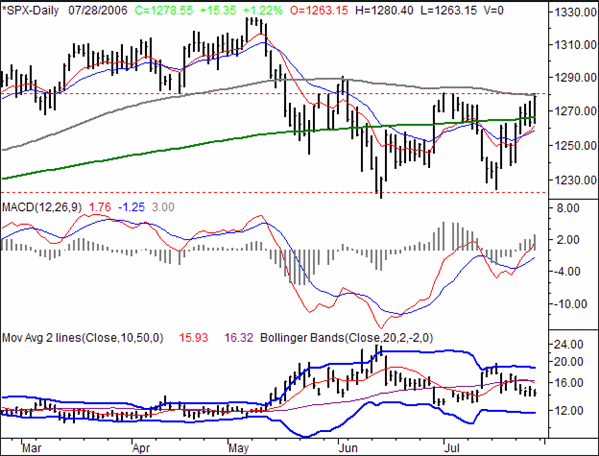
Gaining 15.35 points on Friday (+1.22%) left the S&P 500 at 1278.55 for the week. That close also happened to be 38.25 points (+3.08%) above the prior week's close. So, all in all, the bulls should be pleased. However, they should also be equally concerned; the index is testing some key resistance lines that, so far, don't look like they're going to budge.
The key item to consider for the S&P 500 chart right now (as with the Dow) is the horizontal trading range that became painfully obvious on Friday. Marked with red, dashed lines at 1280 (resistance) and 1220 (support), the SPX has been trapped in that box since late May. And, if Friday's failure to get above 1280 is any indication of the S&P's potential right now, then odds are that the index will stay range-bound, despite the fact that the momentum right now is decidedly bullish.
Adding to the likelihood of a quick halt to the upside movement is the 100-day moving average line (gray), also at 1280. Normally we wouldn't be too concerned about the 100-day line, but considering it was the sole reason for the pullback in early June, we're definitely interested in watching it now.
The Volatility Index (VIX) is technically falling, which would normally be bullish for stocks. However, it too is something of a bearish worry if you look closely at the last few days. Even though the index gained a hefty 3.08% last week, the VIX only fell by about 3.1 points (-17.6%). That's not really a commensurate move, especially given that the VIX barely even budged on Friday - despite the fact that it was the market's second strongest day of the week. The strongest day was Monday, when the SPX rallied by 20 points. The VIX made the biggest move lower that particular day, dropping by about 2.4 points then. But after that, the VIX just flattened. The concern is just this - although the bulls seemed to be bold on Friday to close out the week on a strong note, the VIX says that the bulls aren't really all that confident. Our worry is just one of the "Do as I say, not as I do" variety. The price gains on Friday say one thing, but the VIX's lack of appropriate movement says there's really not all that much conviction behind the move.
In any case, keep an eye on the S&P 500's support and resistance lines, as well as the VIX, in the coming week. If the S&P 500 breaks above 1280 and the VIX moves lower than 14, then the market has a shot at a short-term bullish move. Just be on the lookout for things to move in the other direction.
S&P 500 Chart

Dow Jones Industrial Average Commentary
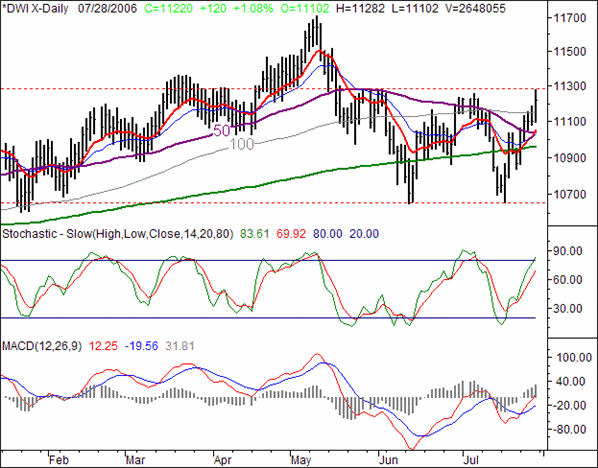
The Dow Jones Industrial Average added on 120 more points (+1.08%) on Friday, bringing the weekly close up to 11,220. That was 352 points higher than the previous Friday's close, locking down a weekly gain of 3.24%. But, like all the indices, the Dow is now at a key inflection point. On the other hand, the Dow also offers the most hope for chart watchers, consistent with our contention that no matter what the Dow stocks are the safest place to be.
Yes, in terms of momentum, the picture is indeed bullish. However, we have to caution you that we've seen this kind of move before. In fact, we saw an almost identical move just a few days ago. That's how the trading range was clearly defined. Check out the two red, dashed horizontal lines on the chart. The lower one is support, around 10,665 while the upper one around 11,284 is resistance.
It's almost scary how precise both lines have been in terms of support and resistance. And, with the Dow closing well under that resistance mark on Friday after reaching it with ease on an intra-day basis, we have to think that a lot of sellers were just waiting to see the index get that high again, and then start selling into strength. After all, that's what happened in late May, and pretty close to what happened in early July.
As for other similarities, we're close to being as stochastically overbought now was we were in late July. So, for obvious reasons, we don't want to jump the gun with the recent moving average crossovers. Normally they'd be buy signals, but they were false signals jus a few days ago.
If the Dow breaks (and stays) above 11,284, then the bulls can talk. Until then, we have to assume the pattern will repeat itself as the Dow starts to pull back to recent lows or support levels.
Dow Jones Industrial Average Chart

Price Headley is the founder and chief analyst of BigTrends.com.