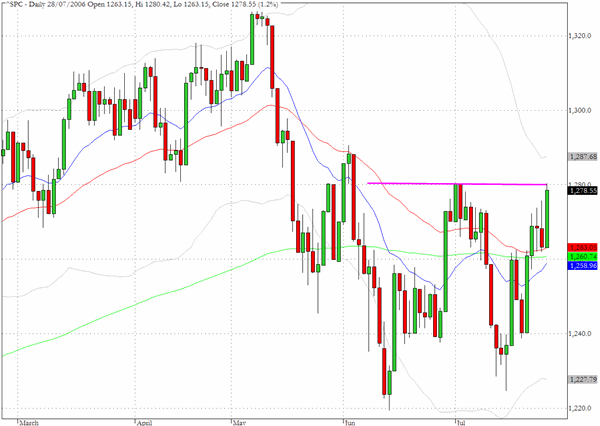
The softer than expected GDP figures released on Friday were the impetus that the indices needed to push back to the top of the recent trading range. No index exemplifies this better than the S&P 500 which closed marginally below the pivotal 1280 level.
Last week saw some overall positive developments for the index as it moved up from 1240 to 1280 but the crucial test will come this week as we need to overcome the resistance around 1280. If we can maintain Friday's positive tone and if long term Treasury yields continue to weaken we may be able to put the weakness since May behind us. At the moment, we would favor giving the bulls the benefit of the doubt.
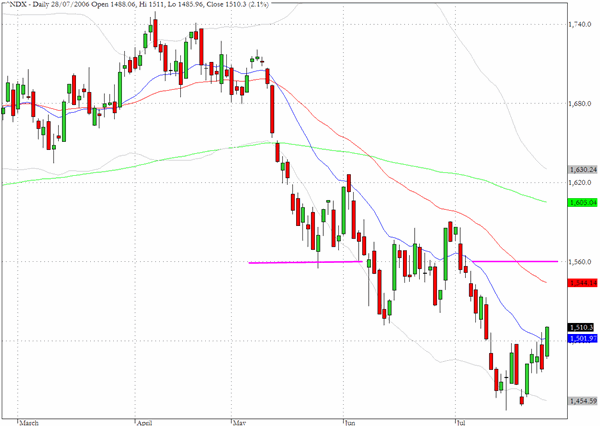
The Nasdaq 100 (^NDX) realized a 2.1% gain on Friday closing at 1510. There were signs of life on Friday for some big names in technology, which is not saying too much since many of these stocks have been moribund for weeks, but we should not underestimate the work that lies ahead for this index. The 1550-60 area will be an important barrier to cross and beyond that 1620 which is about 8% above Friday's close.
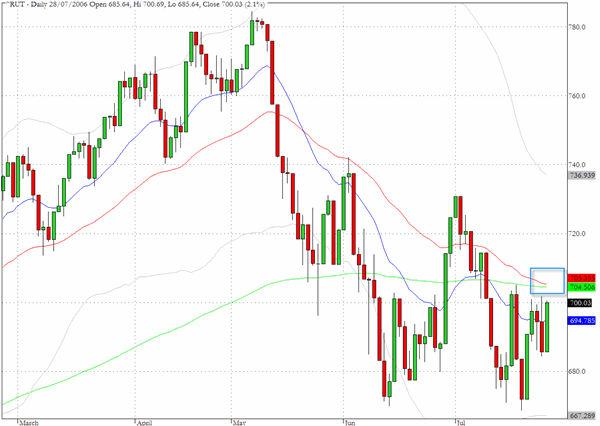
The Russell 2000 (^RUT) along with the Nasdaq 100 registered a 2.1% gain on Friday and closed about five points below the important intersection of the 50-day EMA (the red line) and the 200-day EMA (the green line). If we were to extrapolate the comparable levels from the S&P 500 chart this index needs to establish 720 as a platform in preparation for mounting a challenge to the 740 level to suggest that the markets have successfully seen off the three month correction.
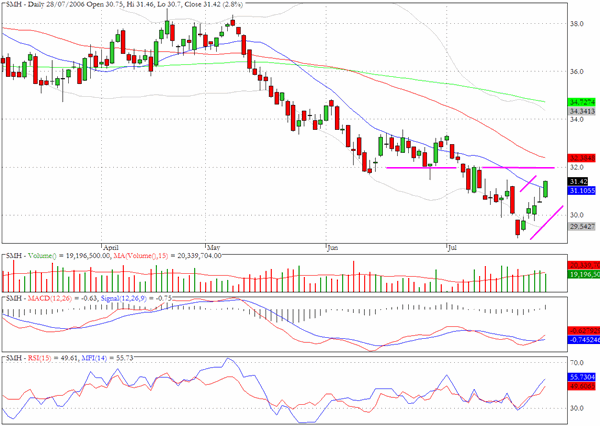
Benefitting from the general good feelings on Friday was the ETF for semiconductor sector, SMH, which achieved a 2.8% gain for the day. Increasing Volume last week was uniformly associated with higher closes and there may be an intermediate term base in place. As the chart show some retracement at the $32 level is to be expected.
TRADE OPPORTUNITIES/SETUPS FOR MONDAY JULY 31, 2006
The patterns identified below should be considered as indicative of eventual price direction in forthcoming trading sessions. None of these setups should be seen as specifically opportune for the current trading session.
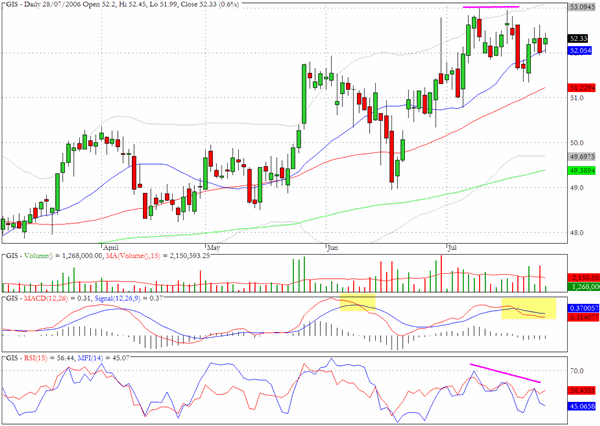
General Mills (GIS) is suffering from negative divergences on both the money flow and MACD charts.
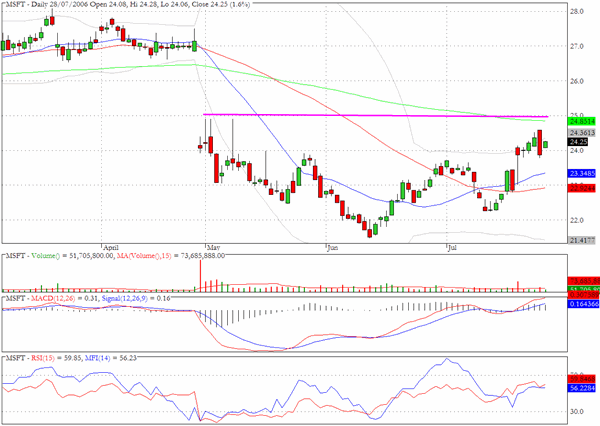
Microsoft (MSFT) will face some stiff resistance at $25.
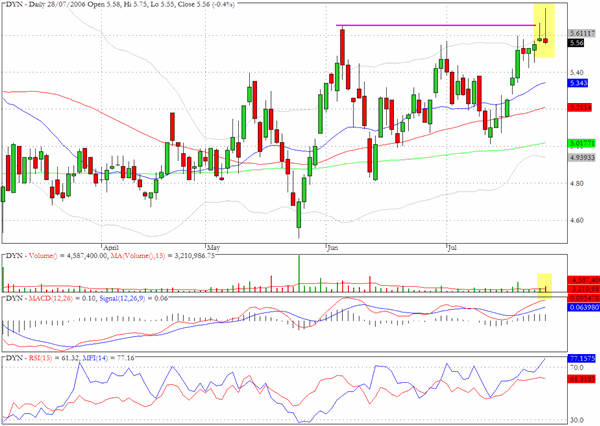
Dynegy (DYN) has back to back Shooting Star formations as it tries to break above the recent highs.
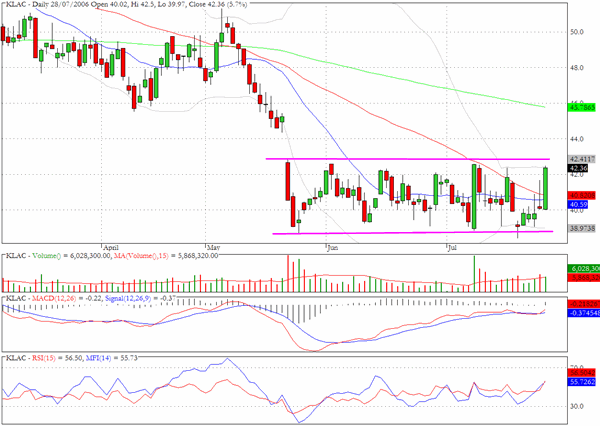
KLAC is at the top of an extended horizontal channel - the upper level of which coincides with gap down close in the latter part of May.
Clive Corcoran is the publisher of TradeWithForm.com, which provides daily analysis and commentary on the US stock market. He specializes in market neutral investing and and is currently working on a book about the benefits of trading with long/short strategies, which is scheduled for publication later this year.
Disclaimer
The purpose of this article is to offer you the chance to review the trading methodology, risk reduction strategies and portfolio construction techniques described at tradewithform.com. There is no guarantee that the trading strategies advocated will be profitable. Moreover, there is a risk that following these strategies will lead to loss of capital. Past results are no guarante of future results. Trading stocks and CFD's can yield large rewards, but also has large potential risks. Trading with leverage can be especially risky. You should be fully aware of the risks of trading in the capital markets. You are strongly advised not to trade with capital.