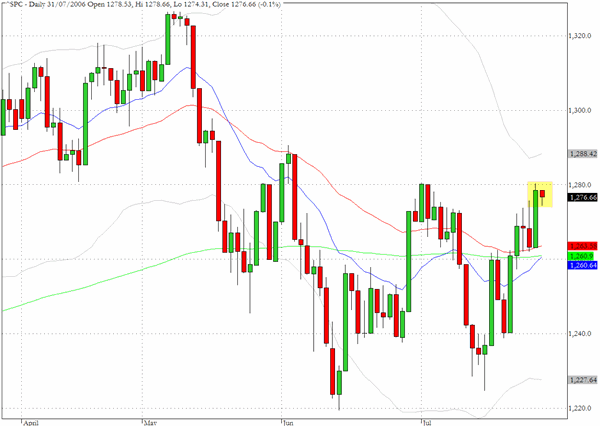
The last day of July brought a very quiet session as most of the indices barely budged from where they settled last Friday. The S&P 500 chart shows a tiny inside day candlestick just below the critical 1280 level. Volume on the SPY proxy came in at approximately fifty percent of the 15-day average
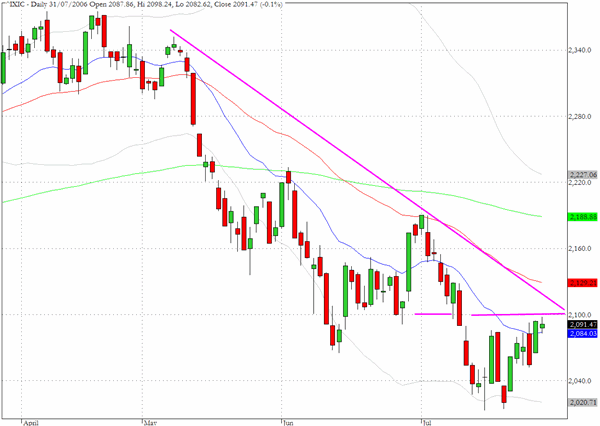
The Nasdaq Composite (^IXIC) also registered a narrow range candlestick as it contemplates the hurdle ahead. Pushing through The 2100 level would violate the descending three month trend line and provide a platform for taking on the 2160 level.
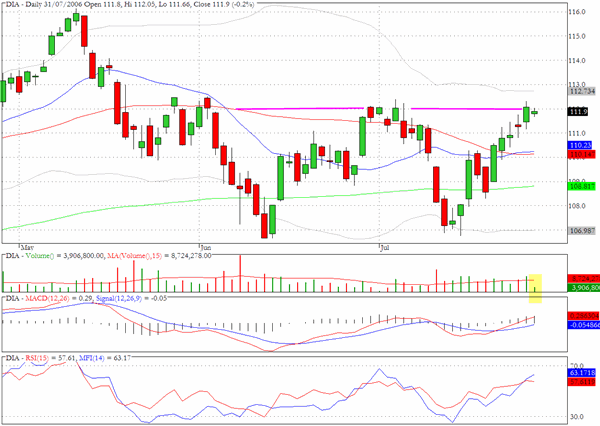
The chart for the Dow Jones Industrials proxy DIA underlines the subdued volume in yesterday√Ę‚,¨‚"Ęs session as once again the index hesitates at the resistance hurdle that lies ahead.
The Amex Natural Gas index (^XNG) has stalled three times previously at the 440 level over the last year but yesterday pushed above to record its first ever close above this level. Individual stocks in the sector were also big movers yesterday as Peabody Energy (BTU) gained 8%, Patterson (PTEN) moved up 7% and Grey Wolf (GW) by more than five percent.

TRADE OPPORTUNITIES/SETUPS FOR TUESDAY AUGUST 1, 2006
The patterns identified below should be considered as indicative of eventual price direction in forthcoming trading sessions. None of these setups should be seen as specifically opportune for the current trading session.
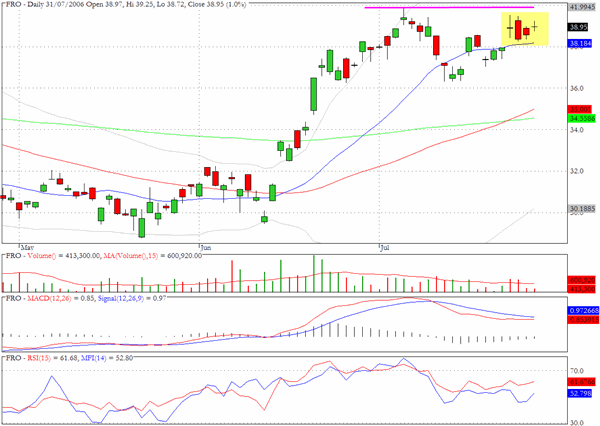
Frontline (FRO) could be vulnerable to corrective action as there would appear to be overhead resistance at the $40 level.
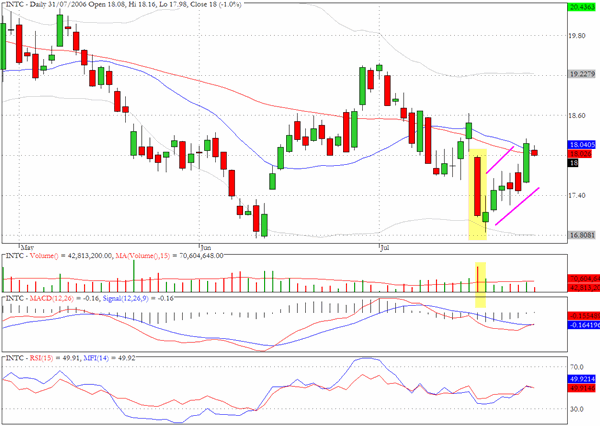
Intel (INTC) has rallied back from its steep sell off in mid July and may now be vulnerable to further selling.
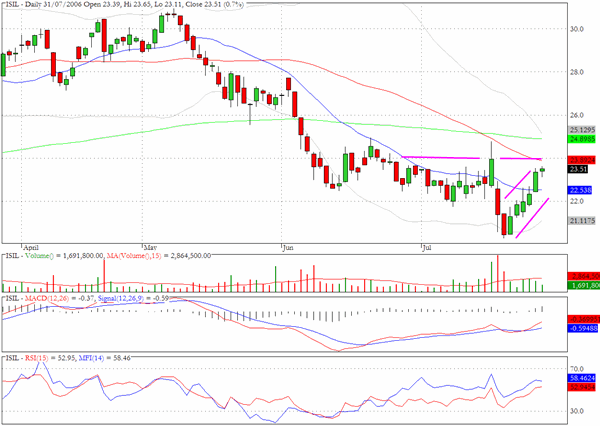
Intersil has similar issues to those we have just noted for Intel.
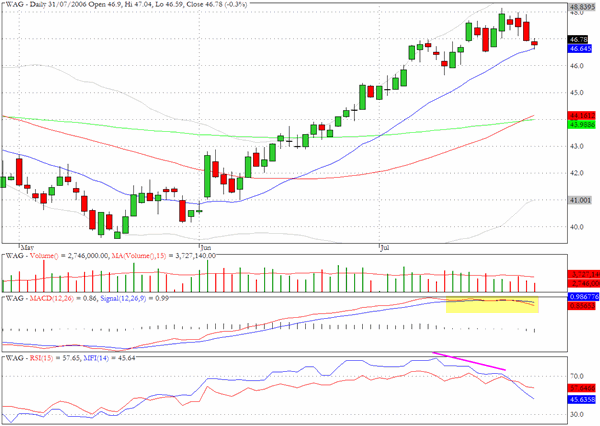
The chart for Walgreen (WAG) is showing a momentum peak and negative money flow divergence.
Clive Corcoran is the publisher of TradeWithForm.com, which provides daily analysis and commentary on the US stock market. He specializes in market neutral investing and and is currently working on a book about the benefits of trading with long/short strategies, which is scheduled for publication later this year.
Disclaimer
The purpose of this article is to offer you the chance to review the trading methodology, risk reduction strategies and portfolio construction techniques described at tradewithform.com. There is no guarantee that the trading strategies advocated will be profitable. Moreover, there is a risk that following these strategies will lead to loss of capital. Past results are no guarante of future results. Trading stocks and CFD's can yield large rewards, but also has large potential risks. Trading with leverage can be especially risky. You should be fully aware of the risks of trading in the capital markets. You are strongly advised not to trade with capital.