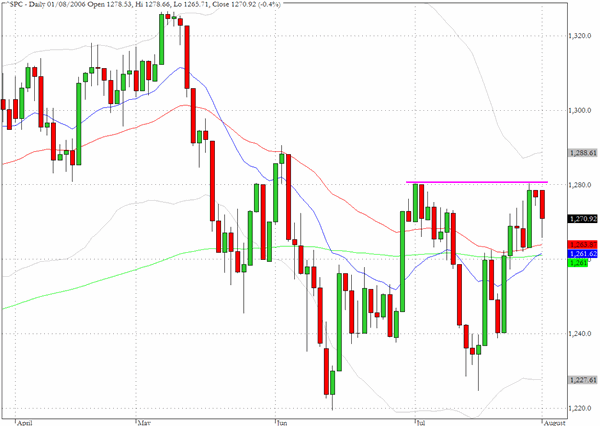
The S&P 500 followed up on Monday's small inside day candlestick with a spike to the downside that stopped short of the lows from late last week. The index closed at 1270 at a level that equated to about fifty percent of its daily range yesterday. The waiting game continues as 1280 has yet again confined the upside and the three moving averages lie below yesterday's low around 1260.
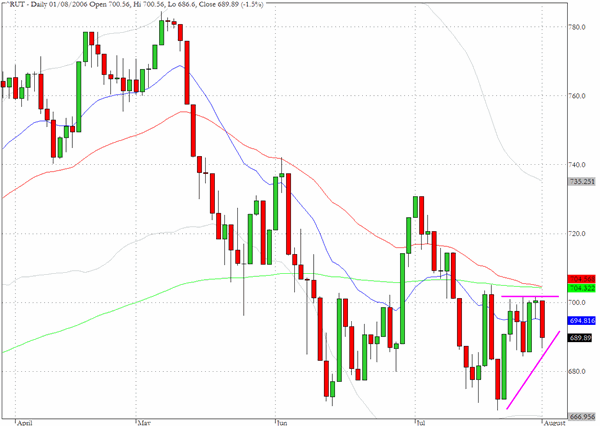
The Russell 2000 (^RUT) suffered a 1.5% drop yesterday but again stopped short of the lows that were touched last week. The index is moving closer to the apex of an ascending wedge pattern where it will either break above the 200- and 50-day EMA's or drop below the ascending trend line from the mid July lows. If we can remain above last week's lows around 685 in the coming days we would expect to see an attempt at 720.
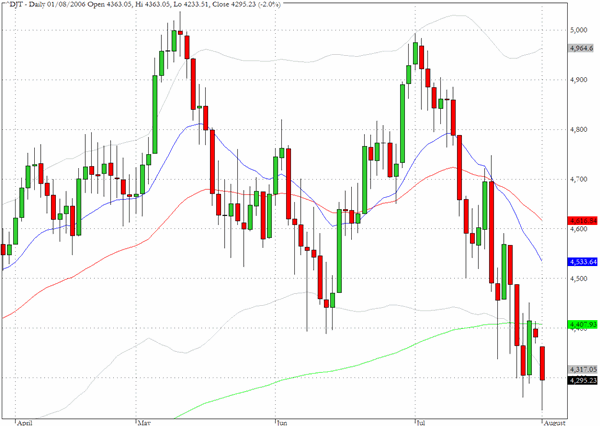
The Dow Jones Transportation index (^DJT) closed down 2% yesterday and marginally reached a new multi-month low. This index has dropped more than 700 points since the beginning of July but is approaching a level in the vicinity of 4200 where previous support/resistance is found and where the index began 2006.
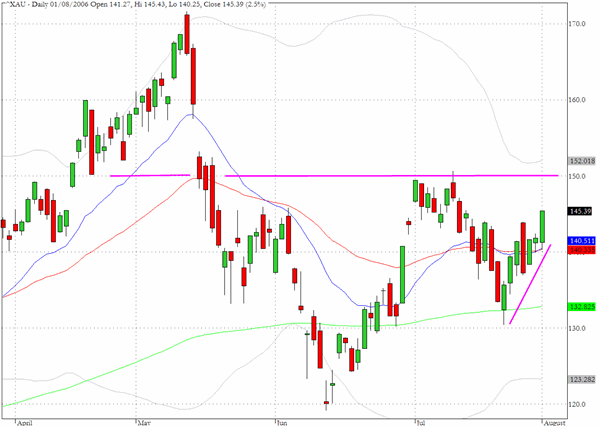
The Amex Gold and Silver index (^XAU) moved up 2.5% yesterday with strong performances from silver stocks such as PAAS as well as the gold mining stocks. In a similar fashion to the S&P 500 which has to overcome a lot of resistance at 1280 the chart formation for XAU suggests that 150 will be a major hurdle as well.
TRADE OPPORTUNITIES/SETUPS FOR WEDNESDAY AUGUST 2, 2006
The patterns identified below should be considered as indicative of eventual price direction in forthcoming trading sessions. None of these setups should be seen as specifically opportune for the current trading session.
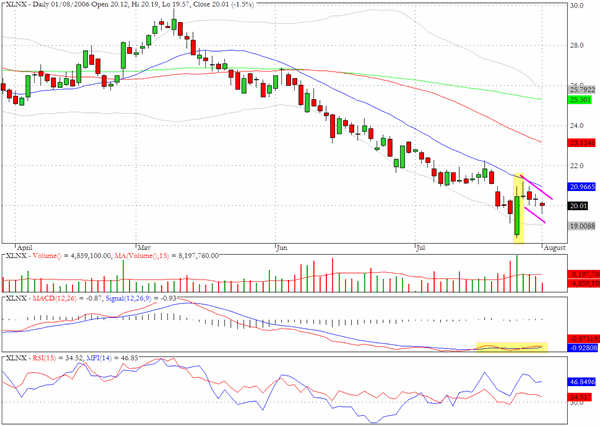
Xilinx (XLNX) has a bull flag formation in conjunction with a turn in the momentum and money flow and $24 would seem to be a feasible target.
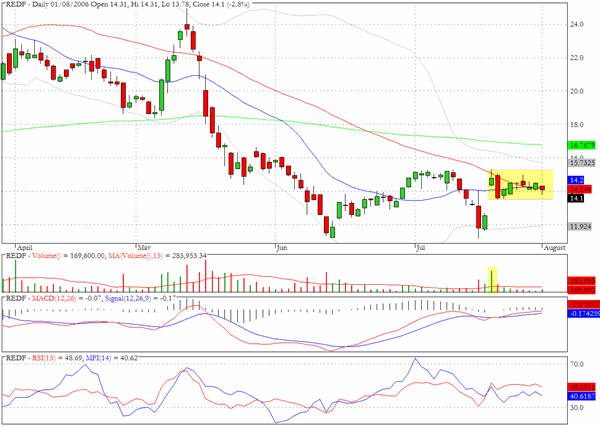
Rediff.com (REDF) has a more horizontal channel formation than the more orthodox one that was observed for XLNX but the gap up on heavy volume in mid July and the volume characteristics are typical of the flag pattern.
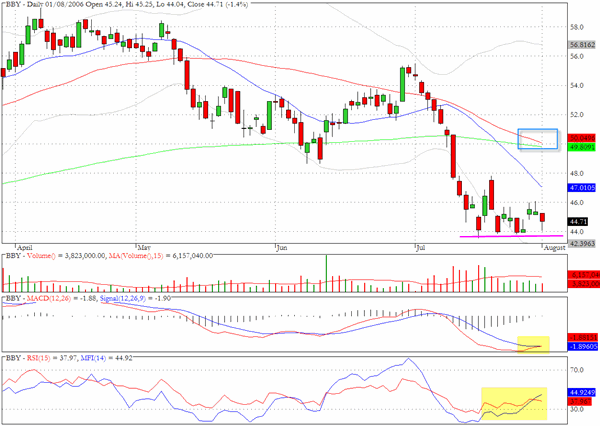
Best Buy (BBY) has shown several periods of below average volume and the momentum and money flow are suggesting that the tide has turned for a move upwards towards $50.
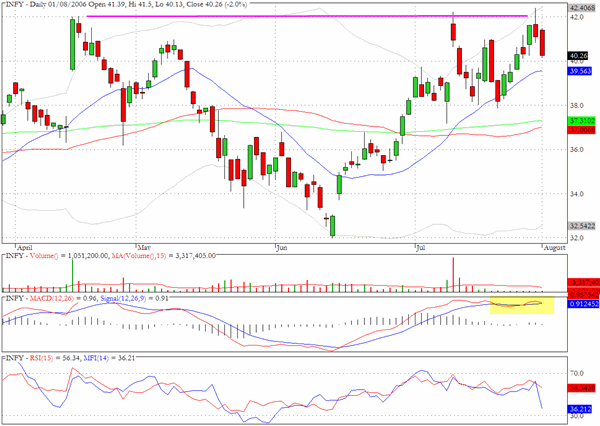
Infosys (INFY) has failed three times to penetrate $42 and it may be at the beginning of a correction back towards the level of the 200 day EMA.
Clive Corcoran is the publisher of TradeWithForm.com, which provides daily analysis and commentary on the US stock market. He specializes in market neutral investing and and is currently working on a book about the benefits of trading with long/short strategies, which is scheduled for publication later this year.
Disclaimer
The purpose of this article is to offer you the chance to review the trading methodology, risk reduction strategies and portfolio construction techniques described at tradewithform.com. There is no guarantee that the trading strategies advocated will be profitable. Moreover, there is a risk that following these strategies will lead to loss of capital. Past results are no guarante of future results. Trading stocks and CFD's can yield large rewards, but also has large potential risks. Trading with leverage can be especially risky. You should be fully aware of the risks of trading in the capital markets. You are strongly advised not to trade with capital.