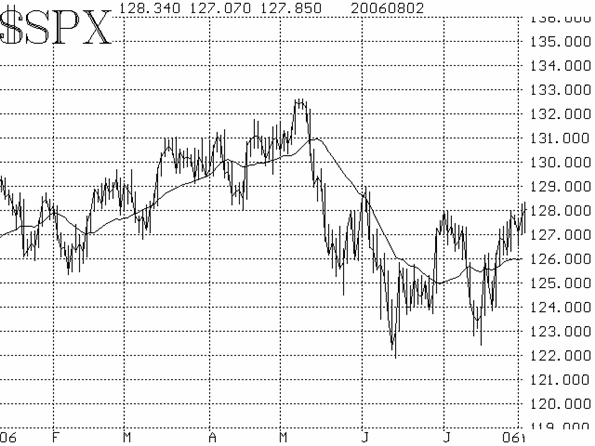
The stock market continued to rise this week, without a lot of help from technical indicators. But we always say that price action is the best technical indicator, so it must be respected. $SPX managed to close above resistance at 1280. There is still some resistance, at the 1290 May top. If it should exceed that, the chart formation would be a rather bullish one, and we would then look for higher prices. However, since the entire 1280-1290 range must be considered a resistance area, we are not looking to get long at this time.
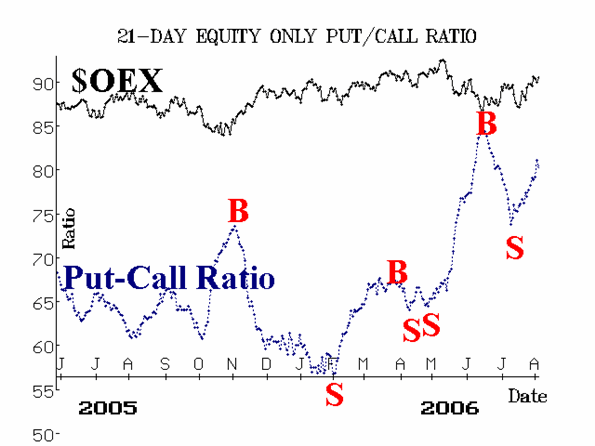
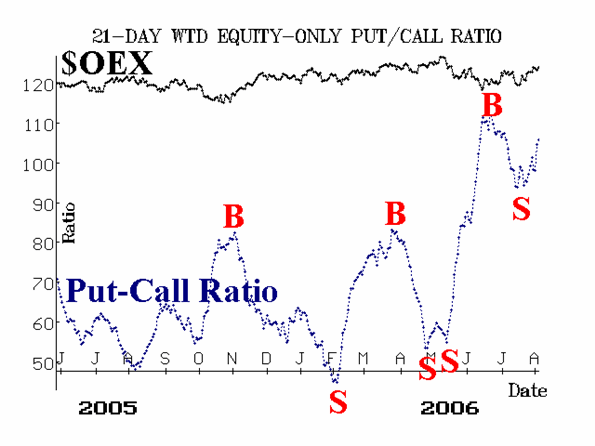
Equity-only put-call ratios remain on sell signals. It is unusual to see them continue to rise as the market itself is rising. When this happens (both the put-call ratio and the underlying price rising in conjunction), it usually means that the put-call ratio signal is unreliable that there is considerable hedging activity which is distorting the put- call data. In this case, however, we are talking about ALL stock options that trade, so there would have to be a LOT of hedging activity to distort the ratio. Perhaps there is, because put volume has been heavy for several weeks even though the market has generally been rising.

Market breadth (advances minus declines) is positive. Actually, it follows the daily moves with extreme daily readings of its own, because of rather uniform institutional activity.

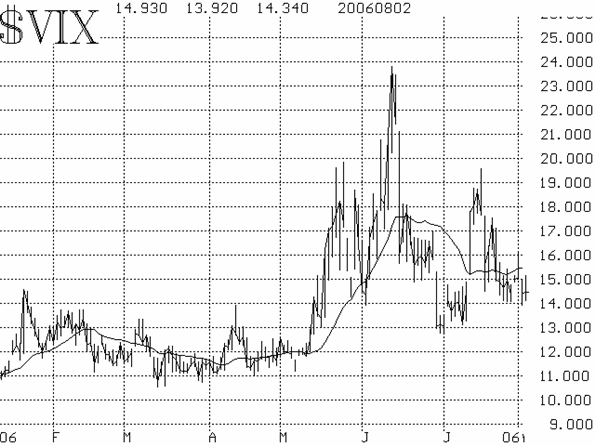
Finally, volatility indices ($VIX and $VXO) have remained rather subdued for the most part. Their continued downtrend over the last few weeks means that they remain on buy signals.

So, in summary, we see buy signals from $VIX and breadth, but the put-call ratios are negative (although there may be hedging distortion there). Finally, $SPX itself is modestly bullish, and a close above 1290 would be a much more bullish sign.

Potential news items may be complicating things: 1) the unemployment report on Friday is sure to appear bullish to some traders and bearish to others (it's the classic case of 'bad news is good news' if job growth is sluggish), and 2) many traders are become more and more certain that the Fed will not raise rates at next week's FOMC meeting. If they are right, this might be a classic case of 'buy the rumor, sell the news.' That is, the market might actually decline right after that meeting if a 'pause' is announced. Of course, if rates are raised, that would be even more negative. Consequently, even if $SPX breaks out over 1290, some amount of caution should be used.
Lawrence G. McMillan is the author of two best selling books on options, including Options as a Strategic Investment, recognized as essential resources for any serious option trader's library.