NASDAQ Commentary
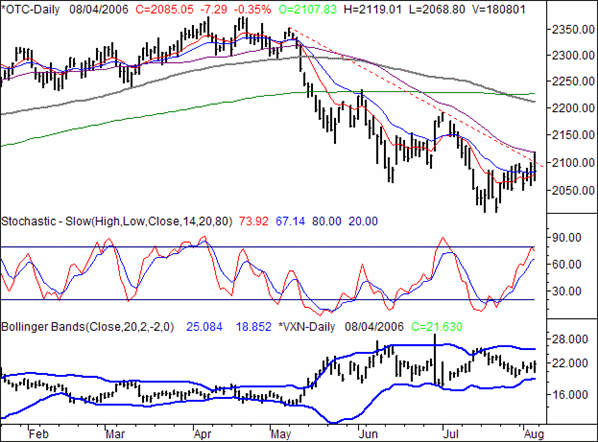
At one point on Friday the NASDAQ Composite was the market's biggest winner. By the end of the session, it ended up being the biggest loser by closing 7.29 (-0.35%) lower, to end the day at 2085.05. For the week, the composite closed 9.09 points lower (-0.43%) than the prior week's close, despite a higher high and higher low.
At the end of last week we mentioned the big gain over those five days didn't really mean a whole lot, as the NASDAQ really didn't have any major hurdles to overcome. This week's tepid movement verifies the concern - when really tested, the bulls didn't seem quite as serious. That hesitation, ironically, may be the very reason stocks fall in the coming week rather than resume their bullish push from the prior week. The pause has essentially given a key resistance line enough to time to sink down right on top of the NASDAQ. Plus, while the market was spinning its wheels, the stochastic 'overbought' indicator kept creeping up into overbought levels. That's just one more thing that will be weighing in on the minds of disappointed traders from last week who were counting on more upside gains. Let's take a detailed look at both...
The long-term resistance line (red, dashed) is currently at 2094, and falling sharply. The NASDAQ actually traded above that line briefly on Friday, getting as high as 2119. But by the closing bell, we were back under that line. It's a slightly-mixed signal, in that we saw trades above there on an intra-day basis, but it's still mostly bearish. Of course, in support of that bearish possibility is the 50-day line (purple) which is exactly where the composite got rolled over during Friday's session. The close ended up just a hair above the 20-day average.
Also take a look at the stochastic chart. It's always possible the index could get overbought and stay overbought for a long while, but given that it hasn't happened all year, we've no real reason to think this time could be any different...especially with the sudden weakness and brush with resistance.
At this point, we'd have to recommend using the 50-day line as the make-or-break level, rather than the longer-term straight-line resistance. But as we said, the path of least resistance is still to the downside.
NASDAQ Chart

S&P 500 Commentary
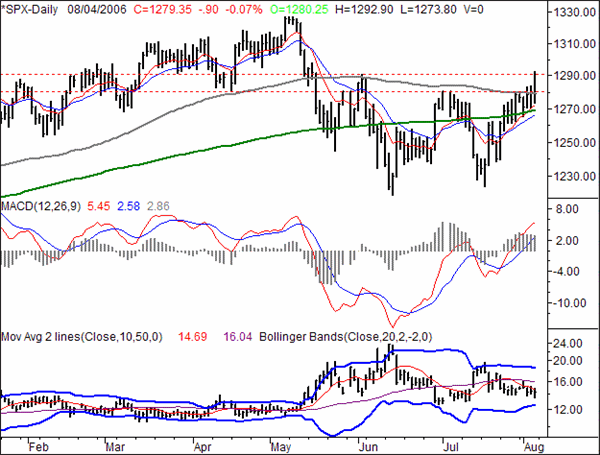
The S&P 500 closed 0.90 points lower on Friday than it did on Thursday, but that 0.07% dip is small enough for us to call it a breakeven. And speaking of, the SPX's 0.8 point gain for the week (0.06%) is also pretty much a breakeven. Of course, the chart looks about as indecisive as the weekly net movement suggests that it should be. In fact, the bull/bear arguments are almost both equally valid. We'll take a look at both sides of the coin.
First and foremost, note that the resistance at 1280 has been broken - a major victory for the bulls who had struggled there more than once in recent weeks. True, the close under there for the week has more bearish implications than bullish ones, but the two-month high we made on Friday means that there has to be at least some buying interest out there. Of course, that two-month of 1292.90 is also above another key resistance level, 1290.
The problem is, the index has done a very poor job of hanging onto gains, especially in recent days. Friday's reversal left the S&P 500 under the 100 day line - a line that has become increasingly problematic.
On the other hand, the SPX does have a couple of things going for it. First, the VIX is technically falling, and still has more room for downside movement. Friday's close of 14.34 is well above the lower Bollinger band line at 12.56. Plus, the 10 day moving average is also sloped lower, verifying the downtrend. Second, the S&P 500 is still above every other key moving average. In fact, some of those averages have actually provided support in the last couple of weeks...even of the market made no net gains on a closing basis. In that light, we can't get too bearish just yet.
The coming week will obviously be critical, as the indices are all at pivots. For the SPX, a close back under the 20-day line (at 1266) is bearish, while a couple of closes above 1290 would set up some more upside movement.
S&P 500 Chart

Dow Jones Industrial Average Commentary
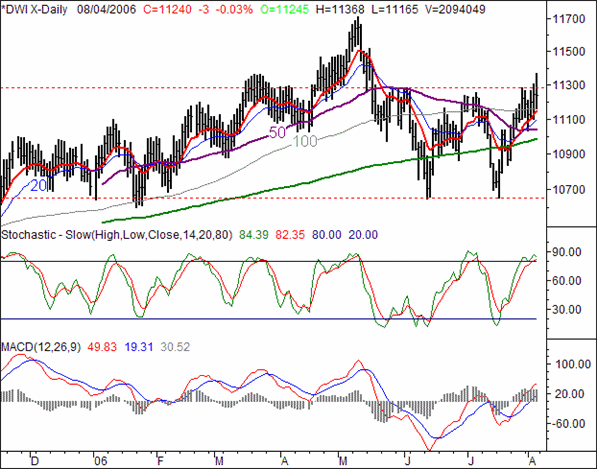
The Dow Jones Industrial Average's 3 point dip into the red on Friday was only an undetectable loss of 0.03%. For that matter, the 0.18% gain for the week (+20 points) was also mostly meaningless. However, the Dow's close at 11,240 is still the second - and higher - weekly close above all the key averages. Technically speaking, that has to be bullish. However, there are still some pitfalls that need to be recognized now rather than after the fact.
The 11,286 line was the very last resistance level we had marked, which happened to be breached with Friday's high of 11,368. So, to some degree, the bulls are chipping away at the Dow's barriers too. But, the close at 11,240 says the effort may not be good enough. Making it even tougher for the Dow to go any higher is the stochastic overbought condition we're now in.
However, never say never. Like the S&P 500, the Dow is still above its key moving averages, including the 100-day line. In fact, it too is finding support from them. We would have no problem getting bullish despite all the potential bearish pitfalls one can find on the current chart. We just want such bullishness to be proven to us for a few more days than usual...we've seen similar patterns like this before, with no follow-through to any of them (take June, for example). On a day-to-day-basis we can't take anything for granted, but by the end of this week, we should be able to make something of a bigger picture call.
In any case, two unique notes about the Dow:
1) Regardless of what happens next (up or down), we think the Dow will still have the most relative strength.
2) Things are likely to remain choppy on a daily basis, even if a trend starts to develop on a weekly basis.
Dow Jones Industrial Average Chart

Price Headley is the founder and chief analyst of BigTrends.com.