While the overall weakness of the US equity markets this summer has been a source of much concern for long-term investors, short-term traders however are relishing in the abundance of volatility that has entered the markets during this time. As discussed in previous issues, the markets weakness is centered upon the tech sector, which has been affecting nearly all other measures. It has continued to be this way despite recent attempts to recover.
The last several trading days have been characterized by a relatively good degree of buying pressures. Markets are once again pushed-up against some key short-term resistance points. The reactions to these will serve as a very good guide to short-term directional impulse. Let's take a look at the charts:

Chart Notations:
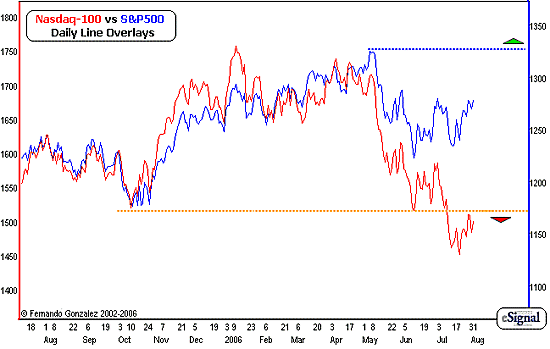
The daily line overlay chart above comparing the Nasdaq-100 or $NDX (red) and S&P 500 (blue) addresses the short-term time horizon
We clearly see the weakness of the Nasdaq here (representing the Techs and other speculative issues of the markets) and conversely, the strength of the S&P 500 (representing a diversified list of primary issues).
Notice that the Nasdaq has been contained over the last several weeks below a key support point (yellow dotted line). This has now served as a tough resistance point. As long as the Naz is contained below this area, it is not likely that the S&P 500 (and therefore the rest of the markets) will be able to experience any sustainable rallies, much less attempt a move towards a new high (blue dotted line).
While overall pressure remains to the downside, this important pivot point in the Naz, which sits approximately at the 1511 area, serves as a mark that will clue us in very short-term directional impulses. Let's consider the inverse: A Daily close above this point will trigger a set of long-awaited rallies to build upon what has already started over the last few days. Bears should be very careful if and when the market is able to close above our pivot point in the Nasdaq (daily basis).

Chart Notations:
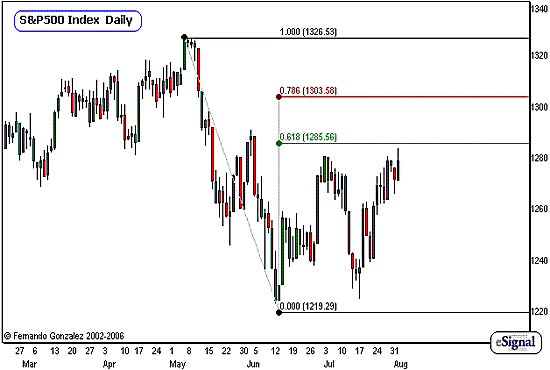
The Daily chart of the S&P 500 Index above addresses the short-term time horizon.
In the chart earlier, we marked 1511 as an important pivot zone in the Nasdaq. The corresponding mark on the S&P 500 would be the 62% Fibonacci retracement.
Above we have measured the Fibs on the S&P 500 beginning with the high of the year and down to its lowest print in June. At this point, the market is fast approaching the 62% retracement (green), which serves as very short-term resistance. This sits at approximately 1285, which we shall treat as resistance.
If the market is able to sustain trade above the 1285 mark, we are looking for continuation of the upward correction into the next Fib mark at 1303, and follow the same process there for a complete 100% retracement. Although this is the S&P 500, let's still keep a close eye on the Nasdaq, as it does greatly affect trends and momentum of the S&P 500.

Chart Notations:
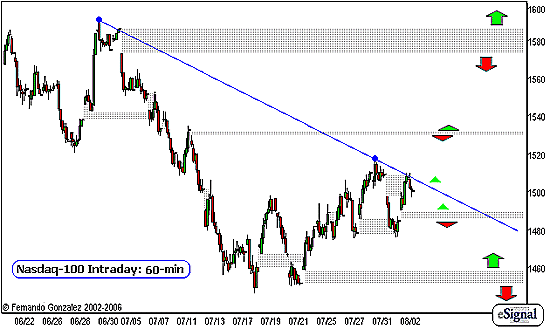
The hourly chart of the Nasdaq-100 above addresses the very short-term time horizon (10TD or less).
The recent volatility in the markets has produced a group of sizable gaps which have been the basis of plenty of good trading over the last few weeks.
Out of the 15 gaps we have in this time period, four remain open. These are marked by the gray areas that extend all the way to the right side of the chart. As we have mentioned many times in the past, gaps are neutral zones: they serve as important support and resistance areas for larger time frame analysis, but one thing is very consistent: greater than 99% of them will be filled, it is just a matter of TIME.
At this point, we will use the open gaps as key areas for setting targets as the market travels from one neutral zone to the next. There is also a trendline in play over the next few days, marked in blue. I have placed the directional guides accordingly, with the size of the arrows indicating size of trend.
Fernando Gonzalez is in his 10th year as an active trader, technical analyst and content contributor to the active trading community and a long list of popular financial media. Online Trading Academy trading knowledge...your most valuable form of capital.