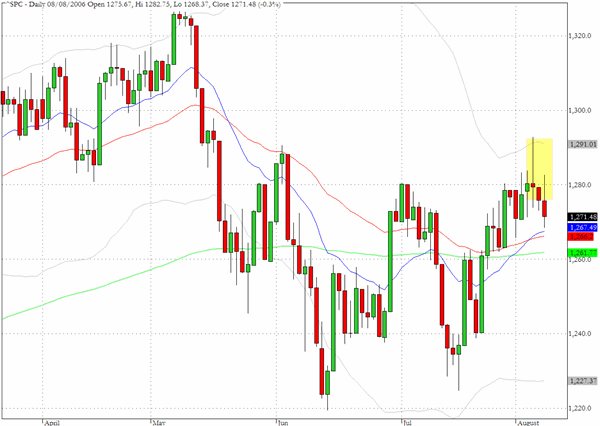
Although yesterday's interest rate decision was in line with what the markets were expecting the actual announcement seems to have left most commentators still guessing whether this is just a temporary pause and that hikes will continue later in the year or whether the U.S. economy is "softening" enough that this cycle may be done. The reaction to the actual annoucnement brought about a strong initial whipsaw and a recovery from mid afternoon weakness late in the session.
It would be dangerous to infer too much from this immediate reaction and on the S&P 500 chart we will be watching two key levels - 1292 which marked last Friday's intraday high and 1260 which would represent a drop below the 200-day EMA.
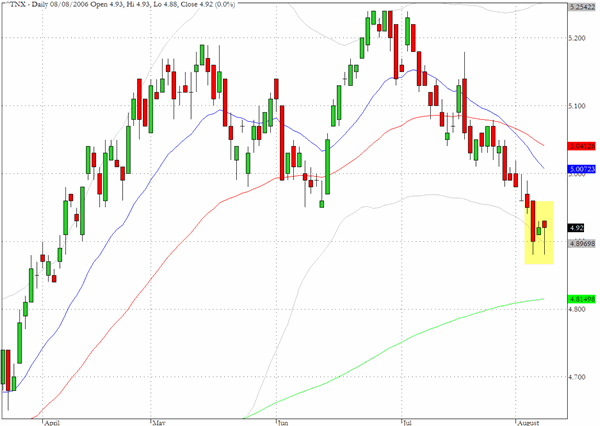
Yesterday we drew attention to the yield on the ten year Treasury note and yesterday's reaction may, as in the case of the equity indices, give us only a partial clue as to how the FOMC announcement will eventually be received. The low yesterday failed to break below last Friday's intraday low on the yield chart.
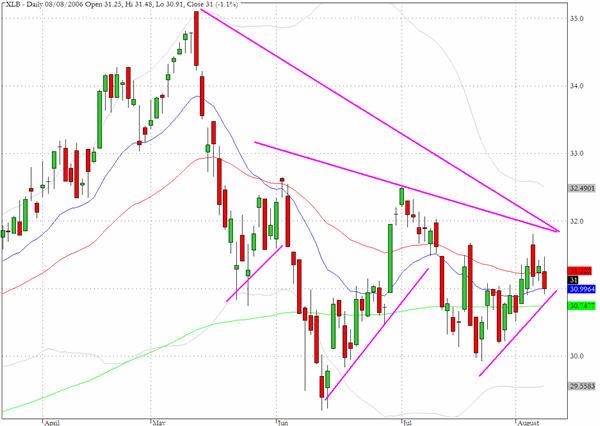
The chart for the the materials sector fund, XLB, shows a series of nested triangles in the context of an ongoing decline from the peak in May. Stepping back from the immediate triangles we can see that the whole pattern since early May is itself another triangle. All of this suggests that the eventual resolution of this pattern when it comes could be quite abrupt (our suspicion is that it could be another down wave echoing the May-June impulse move).
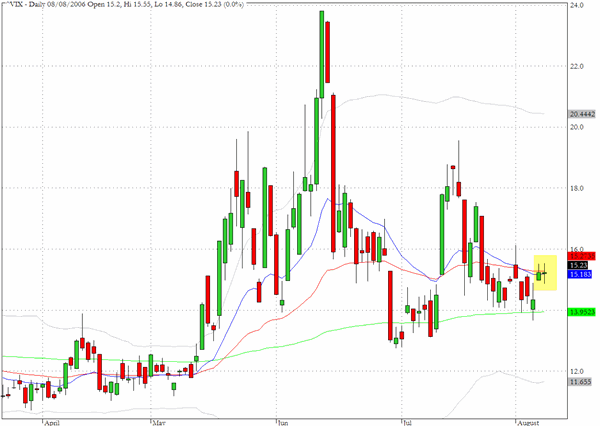
Considering how much intraday volatility was observed yesterday the CBOE Volatility index barely budged.
TRADE OPPORTUNITIES/SETUPS FOR WEDNESDAY AUGUST 9, 2006
The patterns identified below should be considered as indicative of eventual price direction in forthcoming trading sessions. None of these setups should be seen as specifically opportune for the current trading session.
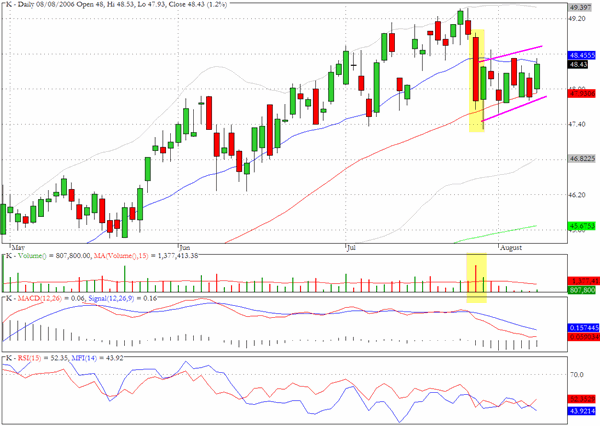
Kelllog (K) has evidence of a bear flag formation and yesterday's move up brings it close to the top of the ascending channel.
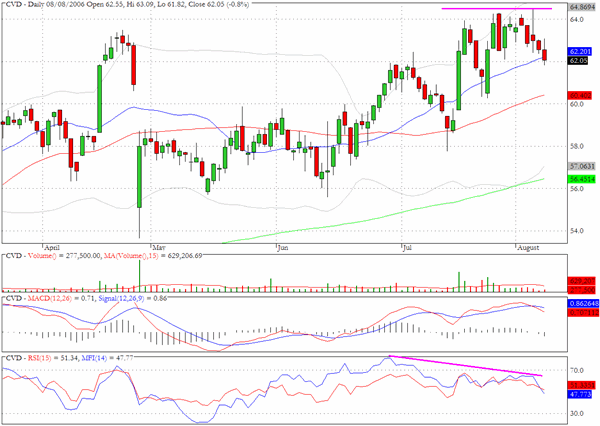
Covance (CVD) has evidence of declining money flow as it seems unable to break above $64.
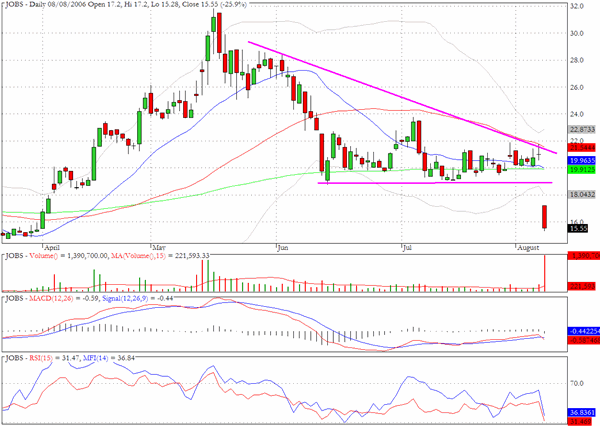
51job (JOBS) fell more than 25% yesterday. Reviewing the chart it can be seen that the stock spent most of the last two months in a descending wedge formation just above the 200-day EMA.
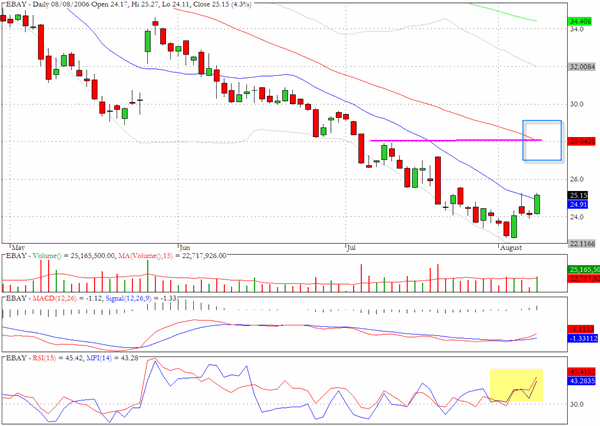
EBAY could be preparing to move back to the $28 level.
We have mentioned XLNX before as a potential bull flag candidate and the volume patterns are still consistent with this being an extended version of the pattern.

Clive Corcoran is the publisher of TradeWithForm.com, which provides daily analysis and commentary on the US stock market. He specializes in market neutral investing and and is currently working on a book about the benefits of trading with long/short strategies, which is scheduled for publication later this year.
Disclaimer
The purpose of this article is to offer you the chance to review the trading methodology, risk reduction strategies and portfolio construction techniques described at tradewithform.com. There is no guarantee that the trading strategies advocated will be profitable. Moreover, there is a risk that following these strategies will lead to loss of capital. Past results are no guarante of future results. Trading stocks and CFD's can yield large rewards, but also has large potential risks. Trading with leverage can be especially risky. You should be fully aware of the risks of trading in the capital markets. You are strongly advised not to trade with capital.