The rules regarding open interest in futures are very similar to those for interpreting volume. However, the rules for open interest require more explanation and are generally applied to stock trading and day trading.
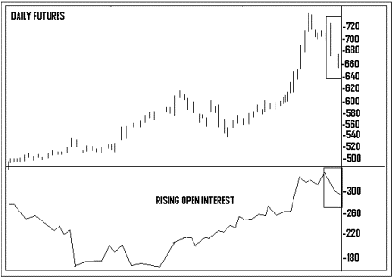
When prices advance in an uptrend and total open interest increases, it means new money is flowing into the market reflecting aggressive buying, and is considered bullish. See the rough example below, which shows the uptrend prices confirmed by the similar rise in the open interest line. The boxes on the right of the chart show normal liquidation of outstanding contracts as prices start to correct downward.

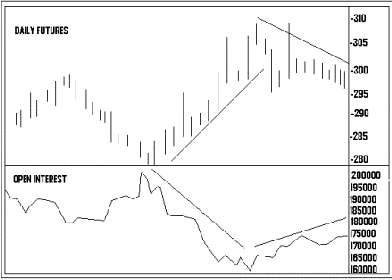
If prices are rising and open interest is declining, the rally is primarily a result of short covering. Short covering applies to holders of losing short positions are forced to cover those positions. Money is leaving rather than entering the market. This is a bearish action because it is believed the uptrend will most likely run out of steam when the short covering is completed. The rough example below shows a price rise accompanied by falling open interest, and a price decline accompanied by rising open interest. If this were a strong trade, the prices and open interest would trend with, not against each other.

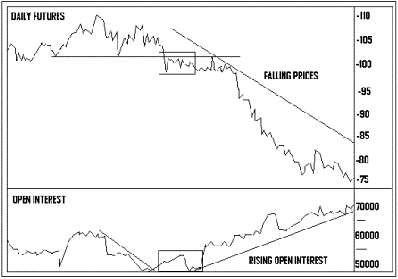
When prices are in a downtrend and open interest rises, our trader recognizes that new money is flowing into the market, reflecting aggressive new short selling. He knows this action increases the odds that the downtrend will continue, and is considered bearish. The rough charting example below shows prices declining and open interest rising as a result of aggressive short selling.

If both open interest and prices are declining, the price decline is being caused by losing longs being forced to liquidate their positions. This action most likely indicates a strengthening situation where the downtrend will probably end once open ingterest has declined enough to show most losing longs have been sold.
In summary, here are four points:
- Rising open interest in an uptrend is bullish
- Declining open interest in an uptrend is bearish
- Rising open interest in a downtrend is bearish
- Declining open interest in a downtrend is bullish
Andy Swan is co-founder and head trader for DaytradeTeam.com. To get all of Andy's day trading, swing trading, and options trading alerts in real time, subscribe to a one-week, all-inclusive trial membership to DaytradeTeam by clicking here.