NASDAQ Commentary
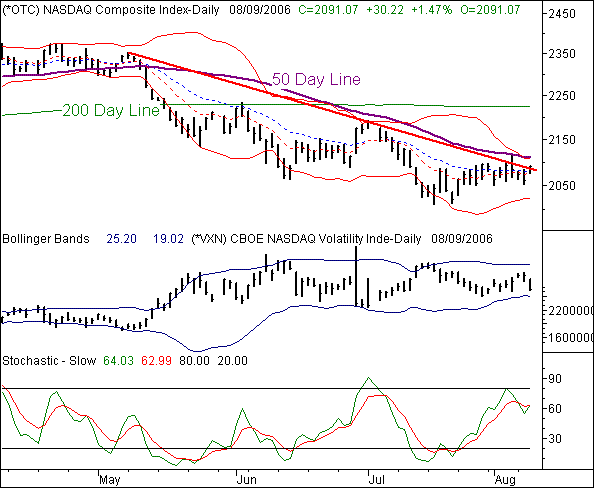
Don't get overly excited about the NASDAQ's 30.22 point gain (+1.47%) today, since it's only up by 6.02 points (+0.29%) for the week so far. The current level of 2091.07 is indeed above an intermediate-term resistance line we plotted a few weeks ago, but it hasn't blown past that mark in a significant way. Plus, the composite is still under the 50 day line, and still hasn't challenged the upper Bollinger band (20 day, 2 SDs) yet. As we've seen recently, that upper band line has the potential to be a major roadblock.
We haven't looked at the NASDAQ's Volatility Index (VXN) in a while, primarily because it hasn't been worth mentioning. That may still be the case, but we're at least starting to see some note-worthy movement from it. Today's VXN drop to 20.35 is the biggest one-day drop we've seen in over a month. This has bullish implications, as the index is rising simultaneously. However, the VXN is still something of a wild card for the time being. Despite the drop, there's some support for the VXN around 20. If any VXN-based bullishness (for stocks) is going to take root, then 20 must be broken and soon. But even after that, the lower Bollinger band line is waiting at 19. For a reason the bulls should worry about that lower band, just check back to late June. Not only will the VNC need to break under 20, it's also going to have to start pushing the lower band line downward if the modest NASDAQ strength has any prayer of actually turning into something longer-term.
As for the NASDAQ's chart, like we said, there are some looming problems for the bulls. The 50 day line is also right where the upper Bollinger band is 2110. Until that resistance line is breached, we can't read too much into today's gains.
Obviously this makes the next few days critical. Also note that we won't have much more clarity by the end of the day, we may need to wait until the end of the week before all of these questions get answered.
NASDAQ Chart

S&P 500 Commentary
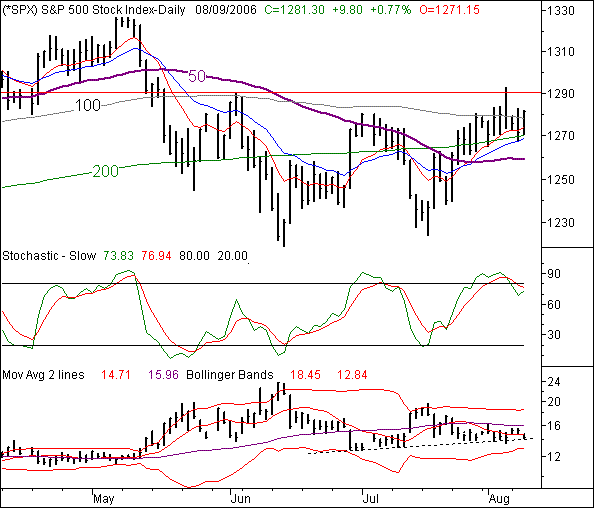
The S&P 500 is up 9.8 points (+0.77%) today, currently hovering at 1281.30. For the week, it's only up 1.95 points (0.15%). However, we have to confess that the SPX's chart actually looks pretty bullish relative to the NASDAQ's, a relative strength we've seen in place for weeks, actually. In any case, we have to call a spade a spade...which should let the bulls relax at least a little.
Here's what we know...the resistance at 1280 that we marked several days ago has not been completely obliterated, but it's not even close to being the focal point anymore. However, resistance around 1290 has become a much bigger deal. That's slightly above where we topped out in early June, and slightly below where we topped out late last week. That line will have to fall to fully convince us the market is staging another rally.
On the other hand, every other resistance line is behind the index - not in front of it. Pick any moving average line you want the S&P 500 is above all of them, including the 100 day line that had been a problem just until this week. More than that, the SPX has found support (precise support) at one of them or another during the last several sessions. No, the bulls are not going to give up without a fight.
The S&P 500 Volatility Index (VIX) looks a whole lot like the NASDAQ's, in that it's down sharply today, but not exactly blasting to lower lows. The overall downtrend for the VIX is clear, albeit a bit muted. And, stocks have risen accordingly through the same timeframe. The challenge is going to be this...can the VIX go any lower or not. There's still that nagging support line (dashed) at 14.30, while the lower Bollinger band (20 day, 2 SDs) is at 12.80. Both have the potential to bring a quick end to any uptrend. To see this reality come into view at the same time stocks begin to stall is a major red flag.
As with the NASDAQ, the next few days are critical. For the bulls, a break past 1290 is the key. For the bears, being stochastically overbought isn't enough right now. Only a close under the 50 day line would serve as an official sell signal at this point.
S&P 500 Chart

Dow Jones Industrial Average Commentary
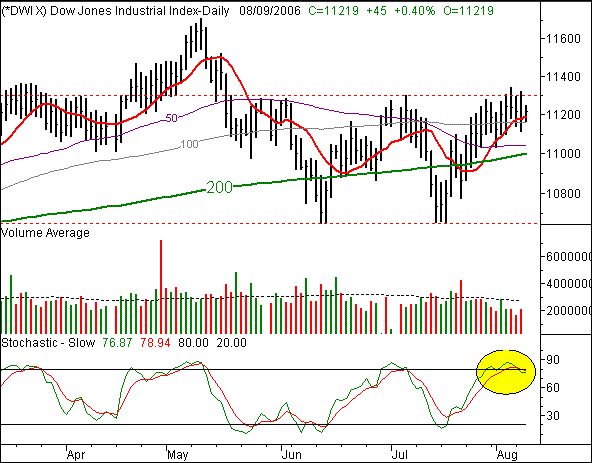
The Dow Jones Industrial Average added on 74 points today (0.67%) to end the session at 11,200. For the week, the blue-chip index is still down 20 points (-0.18%), and still under the critical 11,260 area. On the other hand, it's the only index still above all of its key moving averages.
On the other hand, the Dow's horizontal resistance has been stronger than for any other index - a fact we were clearly facing yesterday, again. Only a move above May's high of 11,286 would really get us far enough past that point to say we had broken the barrier. Even then, the other two indices would also have to make significant technical progress side-by-side with the Dow to really justify getting bullish. As with the other indices, we have to assume the Dow will remain range-bound until we have a good reason not to make that assumption.
Dow Jones Industrial Average Chart

Price Headley is the founder and chief analyst of BigTrends.com.