In my current studies, I'm revisiting something that is pretty widely acknowledgedâ€"not unique, but pretty powerful anyway. As is often the case, while I may not be inventing a new wheel, I'm getting a new understanding and appreciation of the existing one. I will start discussing this aspect tomorrow. For today, I'll leave you with a riddle.
Why would the tendency to which I'm alluding not allow me to be a short seller in any of the top three charts….or a buyer in the bottom three? Hint: It keys off what may be the most important price of the day.
All of the charts below will open in a new browser window when you click on the links.
Chart 1
Chart 2
Chart 3
Chart 4
Chart 5
Chart 6
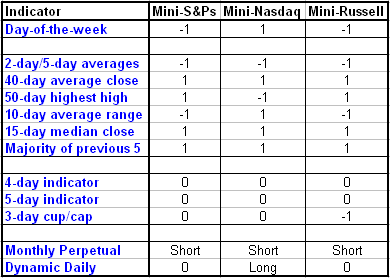
The Nasdaq is the only index that closed higher on Friday. Therefore, its uncontested daily indicator says be long.
The Biases
Reverse from short to long in the mini Nasdaq. Continue to hold short in the mini S&P and Russell.
The bottom two rows determine the signal. Dynamic Day One trumps everythingâ€"you always follow it. When it's neutral, the Monthly Perpetual provides the direction. Click here for a more in-depth explanation of the rules.

DISCLAIMER: It should not be assumed that the methods, techniques, or indicators presented on in this column will be profitable or that they will not result in losses. Past results are not necessarily indicative of future results. Examples presented on this column are for educational purposes only. These set-ups are not solicitations of any order to buy or sell. The author, Tiger Shark Publishing LLC, and all affiliates assume no responsibility for your trading results. There is a high degree of risk in trading.
Art Collins is the author of Market Beaters, a collection of interviews with renowned mechanical traders. He is currently working on a second volume. E-mail Art at artcollins@ameritech.net.