One indicator that I often find useful for short-term market trend confirmation is the relative strength of the Nasdaq Composite compared to other major market gauges. The ultimate reality is that the Nasdaq tends to be home to many high beta growth stocks (stocks which move up or down faster than the market as a whole). This often makes the Nasdaq performance versus standard benchmarks like the S&P 500 particularly telling as to the tone of the overall market trend.
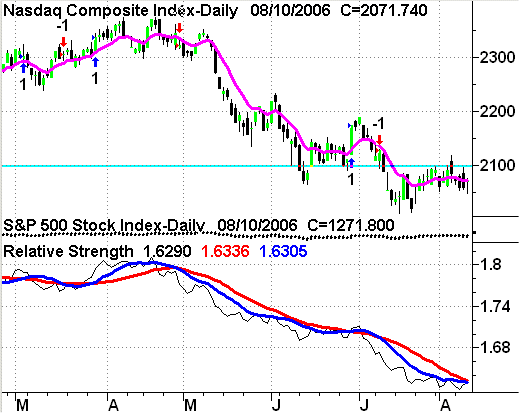
In the chart link below, you will find a chart of the Nasdaq Composite (with a 10-day moving average in red), followed below by the S&P 500 Index, and then in the final lower panel a graph of the relative strength line (in black) of the Nasdaq Composite divided over the S&P 500. The absolute level of this relative performance line is not significant, but rather the trend is what counts. As a result, I plot a 10-day relative strength line (in blue) and a 20-day relative strength line (in red). When the 10-day blue line crosses above the 20-day red line, it implies rising relative Nasdaq performance versus the S&P 500, and a blue up arrow appears on the Nasdaq top third of the chart. When the 10-day blue relative strength line crosses below the 20-day red relative strength line, it implies deteriorating relative Nasdaq performance versus the S&P 500, and a red down arrow is posted on the Nasdaq price chart.
As always, I look for price confirmation of the indicator signal. As a result, buy signals (the blue up arrows) must see upside follow-through in the form of at least a close above the buy signal day's high price. A more stringent condition is to require a new 20-day high. Likewise, sell signals (the red down arrows) benefit most from a new 20-day low as follow-through confirmation. Notice how that saves you from the potential fakeout signals on this chart.
Relative Strength of Nasdaq Composite vs. S&P 500 - Daily

So where are we now? Clearly the short-term trend must be graded bearishly thanks to continuing Nasdaq relative underperformance, combined with downside follow-through. While my longer-term expectation is for a multi-year cycle low this October, my short-term concerns remain. This should allow us to continue to capitalizing on short-term pops to the upside while giving the benefit of the doubt to the bigger downtrend until the Nasdaq gives a new confirmed relative strength buy signal.
Price Headley is the founder and chief analyst of BigTrends.com.