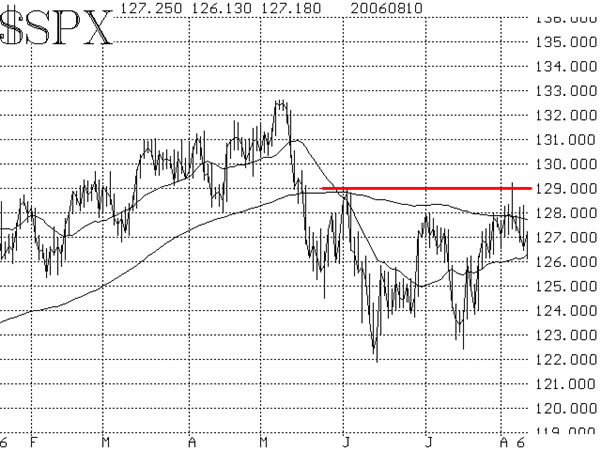
The bulls have had all the news go their way, but they haven't done much with it. Both last Friday, when the unemployment report was announced, and then this Tuesday, when the Fed decided to pause in their rate-raising, bulls poured into the market immediately afterward. However, they were quickly sent scattering when large numbers of sellers showed up. $SPX actually traded above 1280 five different times and above 1290 once (actually trading at its highest price since May). However, it has not been able to close above 1280 even once! This has all the earmarks of the bulls expending their energy just to keep prices level. The bottom line is that the 1280-1290 resistance area on $SPX has held rather convincingly.

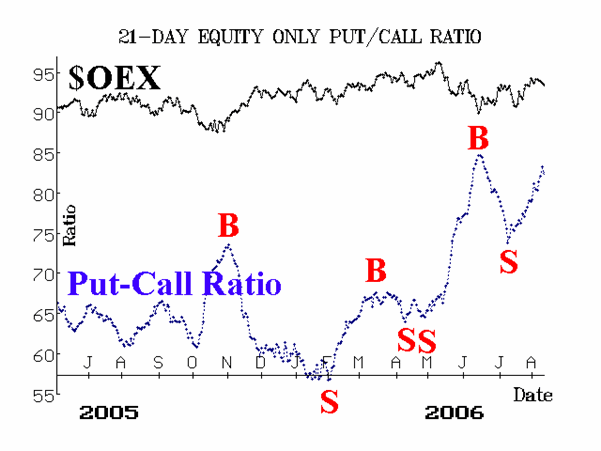
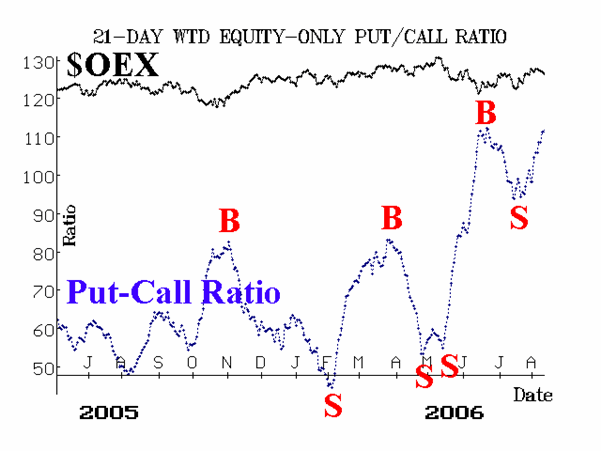
The equity-only put-call ratios remain on sell signals, as they continue to climb. We are somewhat leery of reacting to put-call ratio signals when both the underlying market ($SPX) and the ratio itself are rising. There has clearly been massive put buying, but when one sees that in a rising market, it is usually attributable to hedging. In any case, these ratios are not on buy signals but are oversold in that they are nearing heir highs.

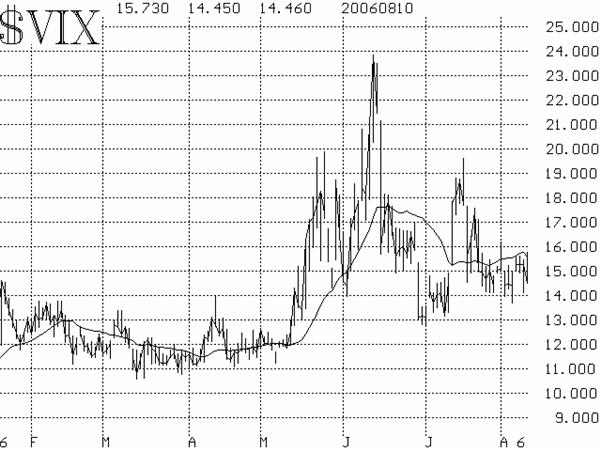
Market breadth (advances minus declines) has been poor. There have been many days of negative breadth, even though the market is near its highest prices since the decline began a couple of months ago. Finally, the volatility indices ($VIX and $VXO) have crept slightly higher, stabilizing in the 14-15 area. This is a bit negative, but not overly so. On more than one recent occasion, we have seen $VIX move higher during a dull or slightly bullish day -- and that proved to be a negative short-term signal. Right now, though, we'd rate the volatility indices as neutral.

In summary, we don't really have any recent buy signals ($VIX and breadth are stale buy signals). Moreover, with $SPX unable to break through overhead resistance, and the generally negative season of late August - September approaching, we are taking a bearish view of things. In addition, $SPX is now approaching the longest time in history (well, in the history of the S&P 500 anyway) without at least a 9% correction. While we realize that fact is not a timing indicator, is does show just how little selling has been done since 2003. Unfortunately, when this much bullishness is packed into the market, the release of that bullish energy is swift and nasty.

Lawrence G. McMillan is the author of two best selling books on options, including Options as a Strategic Investment, recognized as essential resources for any serious option trader's library.