NASDAQ Commentary
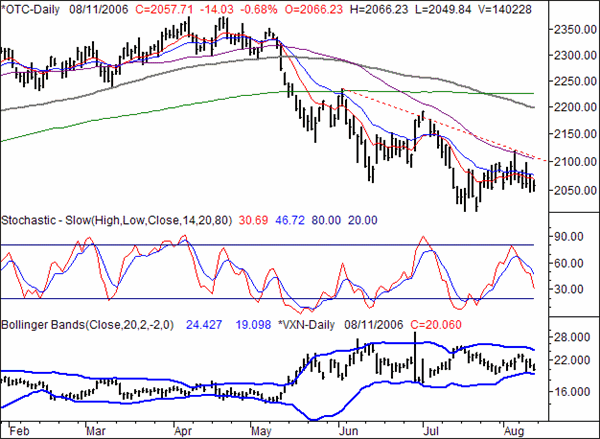
The NASDAQ Composite declined 14.03 points (-0.68%) on Friday to end the week at 2057.71. For the week, the index closed 27.34 points lower (-1.31%) than the prior Friday. That makes four out of the last five weeks losing weeks, with charts looking like we're apt to get more of the same in the near future.
Well, we had said the NASDAQ was likely to continue with its up and down (oversold/overbought) pattern, and that's pretty much how it played out. As soon as the faster stochastic line (%K, red) touched the 80 'overbought' threshold on the 3rd...the day we made the highest close of the month. The next day (the 4th), the composite raced to 2119, hinting of a breakout, but by the end of the day had fallen all the way back to 2085.05. That intra-day rally was a last gasp though...it's been nothing but bearish since then. More than that, we're not even yet to the stochastic 'oversold' area, meaning there's not much - if any - pressure to start 'buying at a low'.
A couple of things to highlight....resistance, mostly. The straight-line resistance (red, dashed) is NOT the same one we had plotted before, but this one - that just came into view - is a little more meaningful. Of course, this is the same line we hit on the same day we ran into resistance at the 50 day line (purple). Now, back under the 10 day line, the momentum is all to the downside. And just for perspective, crosses under the 10 day line have been setting up some rather big dips. The last three have all been 100 point losses or more.
NASDAQ Chart

S&P 500 Commentary
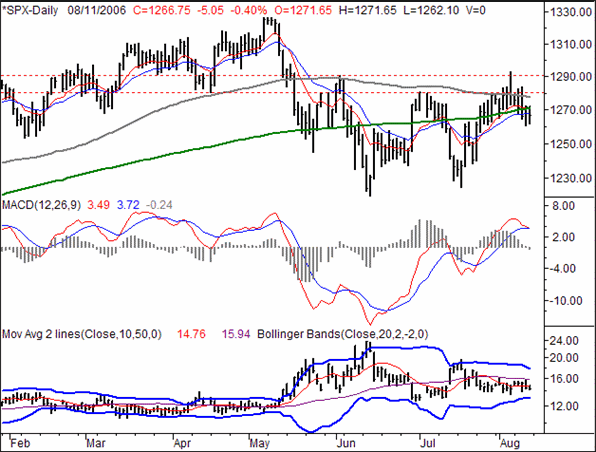
The S&P 500's 5.05 point loss (-0.4%) on Friday left the large-cap index at 1266.75 for the week. That was 12.6 points (-0.98%) under the prior Friday's close, with most indicators saying the recent cross under the 10 and 20 day moving averages has set up a likely downside move.
Several weeks ago we had pointed out that 1280 was a key resistance level. In general, that's still a key level, but don't forget that the 1290 level is also on the radar. Of course, that's not the immediate concern. What we know is - as of Friday - we have a bearish MACD crossunder, and we closed under ALL the key moving averages for the week. That's bearish. If the downtrend gets traction, a dip to the 1220 area is a distinct possibility.
Here's the rub...the CBOE Volatility Index (VIX). It should have moved higher on Friday, as well as for the week. The problem is, it didn't. In fact, it hasn't moved much in a couple of weeks. To really say with any confidence that the market is headed lower, we would also want to see the VIX hint at moving higher. That means the VIX needs to make a couple of closes above 16, where resistance as well as the 50 day average currently are. Otherwise, investors are saying one thing but doing another...an inconsistency that's dangerous.
Give it a couple days here. The odds really do favor a pullback, but a couple more things need to happen first, including a close under last week's low of 1261.30.
S&P 500 Chart

Dow Jones Industrial Average Commentary
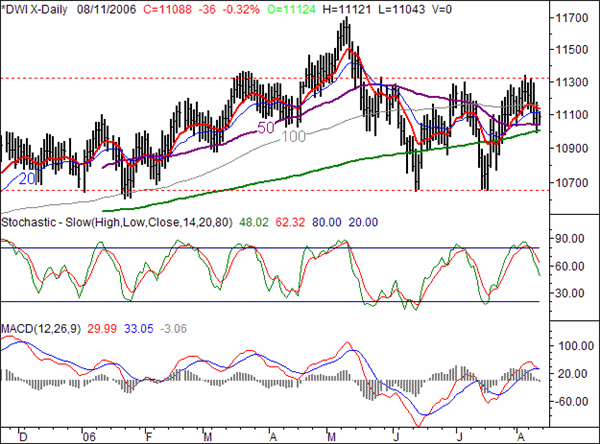
The Dow slid backwards by 36 points (-0.32%) on Friday, leaving it at 11,088 for the week. That's 152 points under the prior week's close (-1.35%), making the blue-chip index the worst weekly performer of our three we regularly analyze.
On the other hand, at least the Dow closed above its 50 and 200 day lines...something that can't be said about any other index.
The thing is, it may not matter. The resistance at 11,25 is still generally on place, although the Dow did make an intra-day high of 11,344 a couple of weeks ago. Of course, that was also the beginning of the end, so to speak. On the same day, both of the stochastic lines (%K, %D) crossed the overbought threshold. We got the official stochastic sell signal three days later. As of Friday, we got a MACD sell signal too. Things look bearish right now, but if the 50 day and 200 day lines at 11,008 and 11,036 don't hold as support, a trip back to the support around 10,660 is a possibility.
Dow Jones Industrial Average Chart

Price Headley is the founder and chief analyst of BigTrends.com.