NASDAQ COMMENTARY
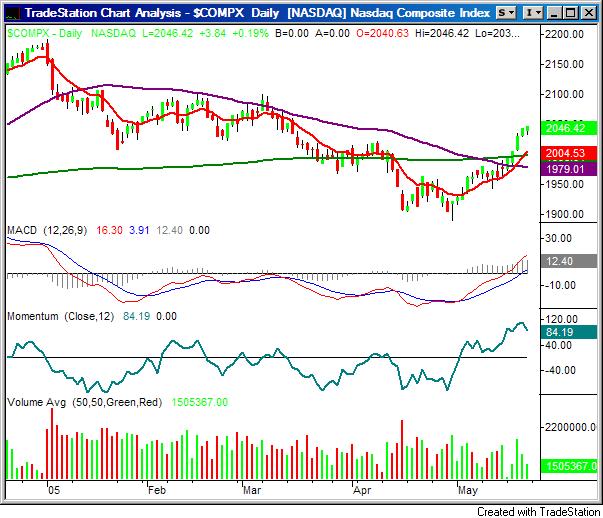
The NASDAQ kept rolling to its third straight weekly gain, this one the biggest of the three. The composite closed 69 points higher (+3.4 percent), reaching the high point at the close on Friday. This is, needless to say, a major shift in things for the year. As we've been saying, the last several days have given us the signs of renewed bullishness for stocks, at least in the near-term. We're going to stick with that theory, although after last week's explosion, we're also seeing some signs that the euphoria is wearing off. Thus, the odds favor at least a brief dip before the bull trends resumes.
And that potential dip is the important aspect of our chart right now. We do think stocks will have the unlikely spring/summer rally after all, lasting a few weeks. But we've gotten a little ahead of ourselves. For starters, we saw a chart gap between Tuesday and Wednesday. We've talked about gaps before, so we'll just briefly say now that there's always pressure to close gaps. That's one of the reasons why the bulls are getting cold feet.
But that's not the only sign. Notice high the NASDAQ how the gap between Thursday's and Friday's close is smaller than the distance between Wednesday's and Thursday's close. The same can be said about the relationship between Wednesday's and Tuesday's close - the rate of gains is clearly slowing down. One particularly subtle hint is the close at the high on Thursday's and Friday's high. On the surface, strong buying at the end of the day feels bullish (and it often is). But in this case, it may well be a sign that the bulls are getting exhausted, and the sellers are just waiting in the wings for them to finish up this wave. A lot of that idea has to do with the fact that the volume was shrank on Thursday, and then again on Friday.....even though the composite was still closing higher. If the NASDAQ was setting up more rally, the volume should have been growing.
To quantify this slow-down we've plotted a momentum line today. See how it's curling over now? Momentum is reversing now, even though the index moved higher.
None of that should change the bigger trend though. The NASDAQ is above all the key moving averages, and both MACD lines are above the zero level. From here, we'll look for a retest of the 10 day line (red) and the 200 day line (green). Both are also right around the psychologically-important 2000 level. We'll set our support line there. Resistance is at 2100.
NASDAQ CHART - DAILY

NASDAQ COMMENTARY - LONG TERM (weekly)
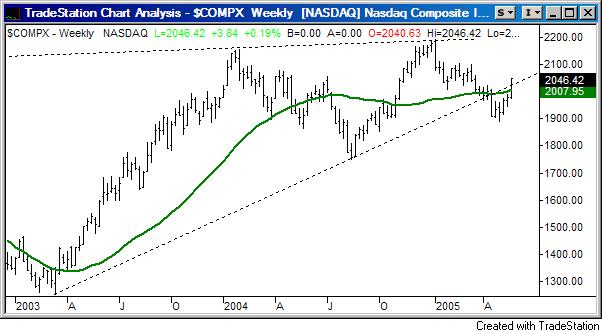
The third winning week in a row pushed the NASDAQ back above the 200 day alone, and prevented it from making a low under lat year's low. So even in the bigger picture, the long-term bull trend is still intact. Long-term resistance is at 2200, which leaves room for a pretty nice rally.
NASDAQ CHART - WEEKLY

S&P 500 COMMENTARY
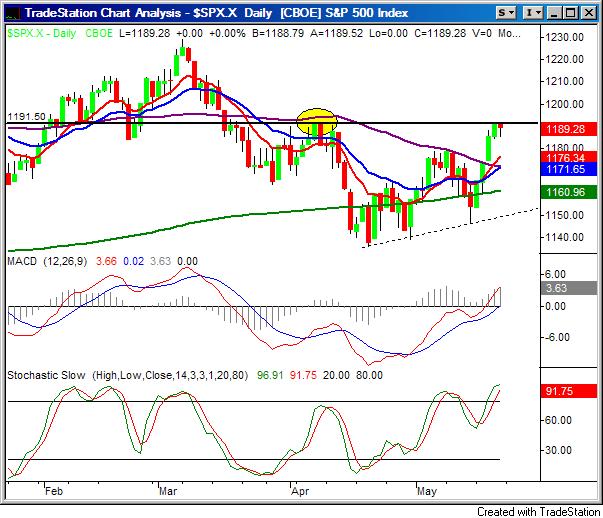
While the NASDAQ closed higher on Friday, the S&P 500 actually lost a little ground. In so doing, very important resistance line was made visible. On both Thursday and Friday, the SPX topped out just above 1191. Were it just those two days we saw it, we wouldn't think a whole lot of it. But we also saw this exact same thing happen back in April - right before the index fell to new lows for the year. Seeing resistance at this level four times in less than two months tells us that this barrier will not be easy to cross.
We ultimately think we will cross it, based on the broad momentum that's been set in place over this month. We just don't think we'll see this S&P move up in a straight line (it hasn't moved in a straight line all year long, why now?). Like the NASDAQ, the pullback point is the 10 day line (red) at 1176. In this case, the other support level is near the converged 20 and 50 day line (blue and purple) at 1171.
But as we said, the market does seem intent on moving higher in the grand scheme of things. The 200 day line is still pointed higher, and there's a support line showing a series of higher lows (dashed) after the S&P 500 hit new lows for the year. Plus, both of the MACD lines are above zero. To get there, there has to be at least a decent amount of upside momentum. If and when the chart gets past 1191. After that, the next resistance level is 1230, where the SPX hit a new 52-week high back in March.
S&P 500 CHART

ECONOMIC CALENDAR

BOTTOM LINE
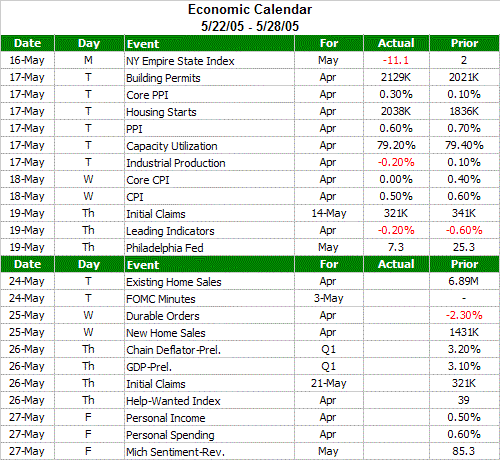
While stocks were rallying last week, the yield curve quietly flattened a bit (and it was already a little too flat to begin with). Treasury prices closed a little lower, especially at the short-term side of the curve. The yield on the 2-year note ended the week at 3.66%, the 10-year note yield was moderately higher, at 4.12%. The yield on the 30-year bond was unchanged at 4.44%. You may be wondering what that's got to with short-term trading. The answer is, it's a vulnerability. If the yield curve flattens more, it runs the risk of being inverted, and that it something that long-term investors do NOT want to see. If they sell because of it, the short-term trend will be to the downside. We only bring it up now to let the swing traders be aware of that possibility. Incredibly, that's one thing that Greenspan did NOT seem overly worried about last week. While he does feel that "there is a little froth in this (housing) market", the Fed doesn't seem concerned (yet) about it, nor are they prepared to raise short-term rates right now, which is good.....sort of. They know that long-term rates are still headed lower, and may be a little hand-cuffed right now. The implication for the economy is that the yield curve could turn upside down if the Fed is forced to cool off that renewed housing strength. If that happens, stocks will suffer.
In any case, the current trend is to the upside, but the profit-takers may impose a short setback in the coming week. Keep it all in perspective.
Price Headley is the founder and chief analyst of BigTrends.com.