The chart for the S&P 500 reveals several long upper shadows or tails to the candlestick formations over the last week indicating the index's inability to hold on to its intraday gains as it tries to break out of the range between 1260 and 1280. Yesterday's close at 1268 was situated very close to the intersection of the short term EMA's and the 200-day EMA lies just below at 1262.
As we move into the latter half of August the markets may find it hard to get energized on either the upside or downside so the path of least resistance may well be to meander further within the recent range. However, one interesting feature that was revealed in our scan from yesterday was the large number of individual stocks that recorded NR7 formations indicating that a major move could be imminent. The month of August has brought surprises before and there is a risk of being lulled into complacency with the rather predictable patterns that have been in evidence recently.

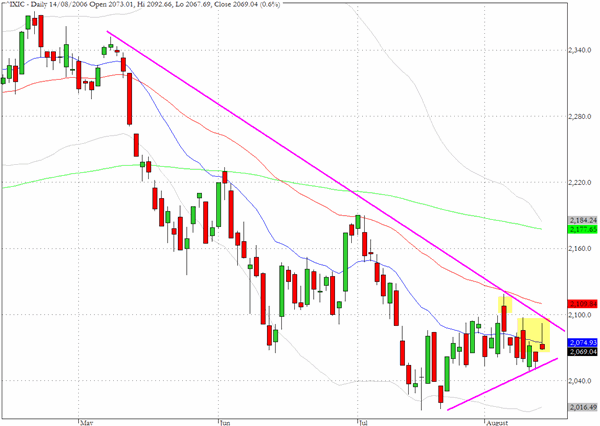
The chart for the Nasdaq Composite (^IXIC) also reveals several long upper tails and as the trendlines that we have added clearly show the index is running out of room in the the steep apex to the triangular pattern. The pattern will not to be resolved soon.
The ten year Treasury note has added ten basis points since it touched the chart support level around 4.9%. The yield yesterday finished at exactly five percent but further progress upwards could be more of a challenge in the near term.

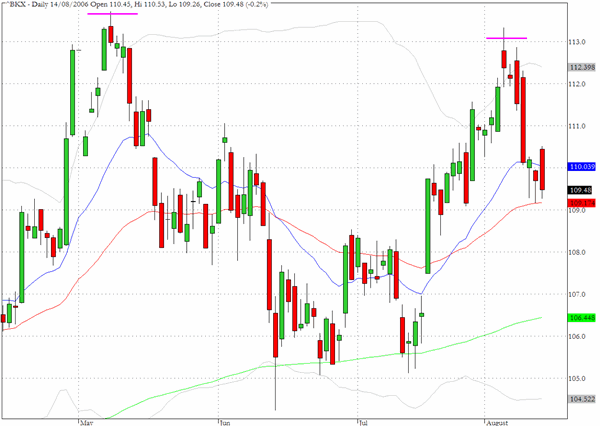
The chart for the banking sector (^BKX) is providing support to the notion that a lower high may have been registered earlier this month and we may be witnessing the beginning of a bearish ascending channel formation.
TRADE OPPORTUNITIES/SETUPS FOR TUESDAY AUGUST 15, 2006
The patterns identified below should be considered as indicative of eventual price direction in forthcoming trading sessions. None of these setups should be seen as specifically opportune for the current trading session.
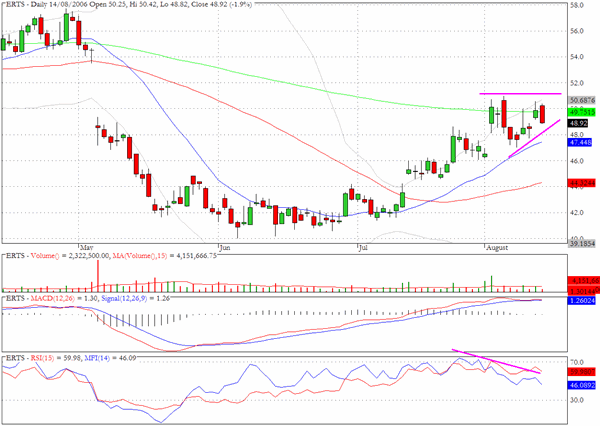
Electronic Arts (ERTS) has reached an area of resistance close to the 200-day EMA and the gap down level from early May. The money flow is deteriorating and a return to $44 is a possibility.
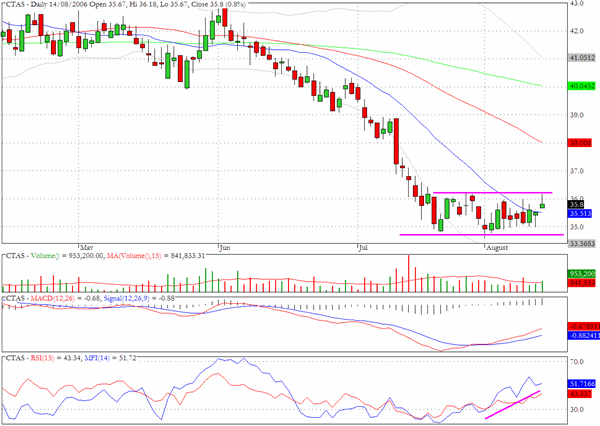
Cintas (CTAS) has moved within a tight channel for the last month but there is evidence from the money flow that it could be preparing to break above. A feasible target would be the 50-day EMA.
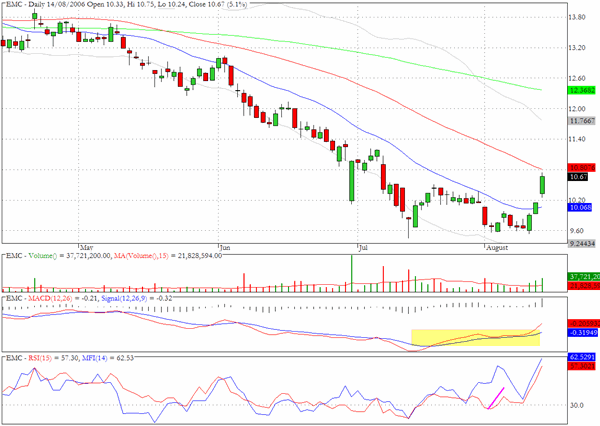
We mentioned EMC recently as showing positive divergences and yesterday the stock surged ahead on almost twice the average volume.
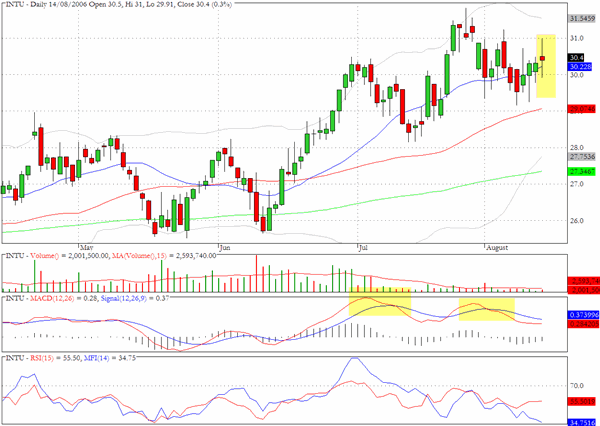
Intuit (INTU) registered a Doji formation with long shadows and there are some negative divergences on the chart.
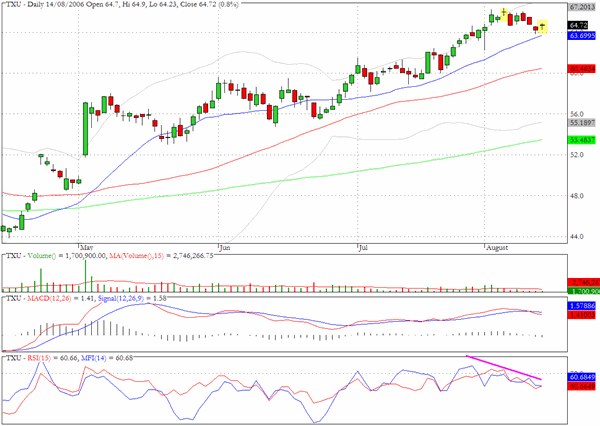
TXU has moved up steadily since early May but could be stalling in the vicinity of $65.
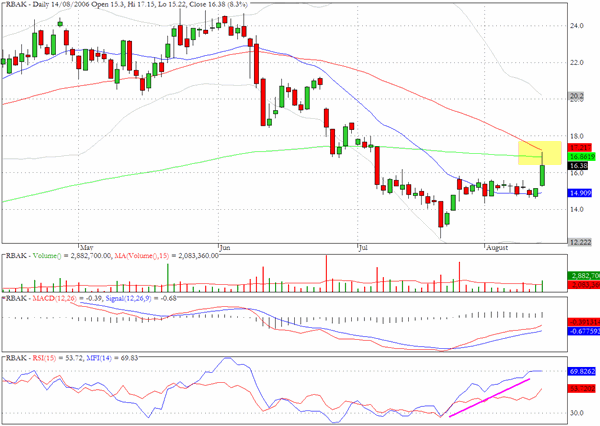
Another stock that we mentioned recently because of its positive divergence was Redback. The move yesterday of more than eight percent brought it to an area of possible near term resistance.
Clive Corcoran is the publisher of TradeWithForm.com, which provides daily analysis and commentary on the US stock market. He specializes in market neutral investing and and is currently working on a book about the benefits of trading with long/short strategies, which is scheduled for publication later this year.
Disclaimer
The purpose of this article is to offer you the chance to review the trading methodology, risk reduction strategies and portfolio construction techniques described at tradewithform.com. There is no guarantee that the trading strategies advocated will be profitable. Moreover, there is a risk that following these strategies will lead to loss of capital. Past results are no guarante of future results. Trading stocks and CFD's can yield large rewards, but also has large potential risks. Trading with leverage can be especially risky. You should be fully aware of the risks of trading in the capital markets. You are strongly advised not to trade with capital.