Consider all the possible market scenarios within a given trading day‚Ä"all the days that have up biases throughout the session and finish near their highs, the days that move relentlessly higher before reversing at the eleventh hour, the days that gap lower on the open and keep dropping, those that open sharply one way and close dramatically in the other direction, the chop days, the do-nothing days‚Ä"all of them. The entire day trade numbers game universe. What can you conclude about days that paid off being long, for instance? Many things, perhaps, but let's start here‚Ä"strong days usually (not always, but often enough) spend most of their day above the opening price. This is true pretty much by definition. Any market that has periodic higher highs and an ultimate close right near that high couldn't have spent most of its day languishing below the open.
If you have a rule that says don't initiate shorts at higher-than-open prices, then you couldn't be on the wrong side of the above scenario. You'd throw out pretty much 100 percent of those cases. If the market wasn't quite as one way but still had a decidedly upward bias, probabilities would still favorably serve you if you applied the rule, albeit not as decidedly as in the above example. But again, we're talking sheer numbers games. Don't fight the tape. The trend is you friend. Sometimes the popular adages are not wrong.
Let's initiate a hypothetical trade in the appropriate direction every day at a give time. Hold it until the close. If we're right, we should be able to do this pretty much at any time throughout the session.
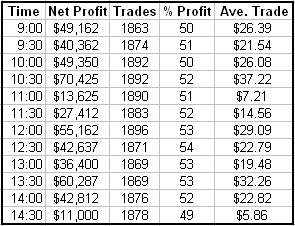
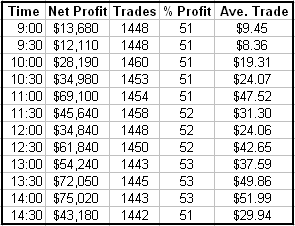
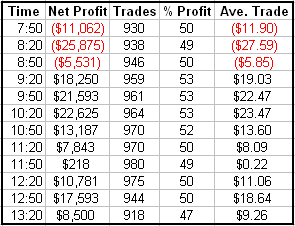
The next three graphics are a snapshot of that idea using 30-minute bars in the mini-S&P, mini-Nasdaq and 30-year treasury bonds. Each line is an entry at a given time (following the direction relative to the open) and exiting on the close. Some markets provide more dramatic results than others, but all pretty much confirm the bias.
At the given time, we are buying higher than the daily open or we are selling (shorting) lower than the daily open. The below charts used four to eights years of data depending on the completeness of the available data.
S&P

Nasdaq

30-Year Treasury Bonds

We could expect widespread implications‚Ä"universal application of this rule regardless of the day trade technique. We'll look at one tomorrow.
The Biases
Tuesday is the start of the monthly buy mode in the indexes. Can it work after having just failed so miserably on the short side? If I were to say no, that would be the best news of all‚Ä"I could then offer you a can't-miss system that fades itself following debacles.
We're not that lucky‚Ä"sorry.
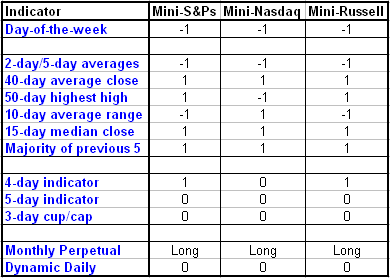
Hold Nasdaq long. Reverse from short to long in S&Ps and Russell.
The bottom two rows determine the signal. Dynamic Day One trumps everything‚Ä"you always follow it. When it's neutral, the Monthly Perpetual provides the direction. Click here for a more in-depth explanation of the rules.

DISCLAIMER: It should not be assumed that the methods, techniques, or indicators presented on in this column will be profitable or that they will not result in losses. Past results are not necessarily indicative of future results. Examples presented on this column are for educational purposes only. These set-ups are not solicitations of any order to buy or sell. The author, Tiger Shark Publishing LLC, and all affiliates assume no responsibility for your trading results. There is a high degree of risk in trading.
Art Collins is the author of Market Beaters, a collection of interviews with renowned mechanical traders. He is currently working on a second volume. E-mail Art at artcollins@ameritech.net.