NASDAQ Commentary
Don't get overly excited about the NASDAQ's 30.22 point gain (+1.47%) today, since it's only up by 6.02 points (+0.29%) for the week so far. The current level of 2091.07 is indeed above an intermediate-term resistance line we plotted a few weeks ago, but it hasn't blown past that mark in a significant way. Plus, the composite is still under the 50 day line, and still hasn't challenged the upper Bollinger band (20 day, 2 SDs) yet. As we've seen recently, that upper band line has the potential to be a major roadblock.
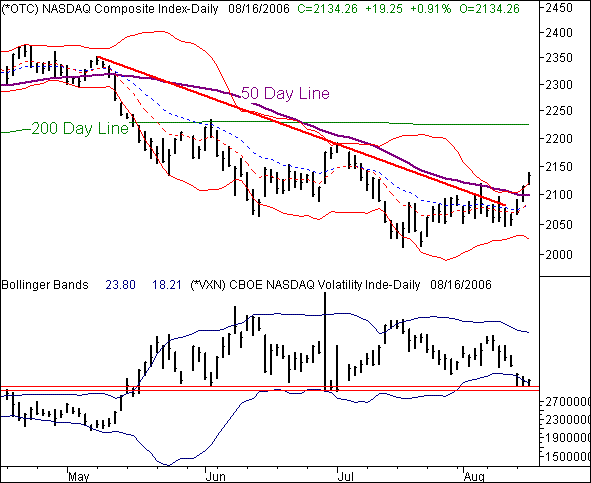
The NASDAQ's 19.25 point gain (+0.91%) so far today leaves it at 2134.26. For the week, the composite is up 76.55 points (+3.72%), thanks to an explosively bullish Tuesday. Yes, that more than topples some technical resistance, but we still have serious doubts about any follow-through. Whether we're wrong or right, we'll know soon enough. (continued below)
In the interest of fair play, we told you we expected to see resistance from at the 50 day line (purple) and/or the upper Bollinger band. The opinion was based on prior instances of the same thing happening recently...we assumed it would happen again. So far, though, neither the 50 day line nor the upper band line have held the buyers back. Point being, this is indeed a technical breakout.
The problem we still have with the surge, though, has nothing to do with what the index chart is doing. Rather, we take issue with what the VXN is not doing.
The CBOE Volatility Index (VXN) should be falling while the NASDAQ is rising. In fact, with a 75 point rally so far this week, you'd think the VXN would be making new lows. Not so though. The VXN, after running into its lower Bollinger band, has failed to actually move any lower. Instead, there's some support for the VXN around 18. More than that, we've seen some support around here before...once in late June, and before that in late May.
Why isn't the VXN going lower like it should? One could chalk it up to expiration week (which is valid to some degree), but more than anything else, it's a case where traders are doing one thing, but planning on another. In this instance, despite the market's rally, traders are playing defense. That's obviously not bullish.
Set in stone? Not at all, but it does leave the market very vulnerable right now. Let's just see how quickly the NASDAQ bounced back from the first bearish retest...if it bounces back. After that, we'll be willing to entertain bullish notions.
NASDAQ Chart

S&P 500 Commentary
The S&P 500 is up 6.1 points today (+0.47%). For the week, the current trading level of 1291.70 is 24.95 points higher than Friday's close (+1.97%). The tough part about the S&P 500, however, is reconciling it with the NASDAQ worries. While the NASDAQ looks ripe for a correction, the S&P's breakout has at least a little legitimacy to it.
What's bullish? The SPX is above all of its key moving average lines, including the 100 day average that had become a bit of a nuisance in the last few months. So, clearly the index is moving higher at least to some degree. At the same time, the S&P 500's Volatility Index - the VIX - is actually moving lower like it should...even though the VXN isn't. In fact, the VIX is hitting new multi-week lows as of today and doing so with a relatively smooth path (i.e. it's not making a big one-day move that's likely to be undone the very next day). All in all, these things are bullish by most standards.
On the other hand, a reality check may be in order. The VIX is set to close under the lower Bollinger band today - something that's been a rarity in recent months. More often than not, the lower band also represents the reversal point for the VIX and a downside move for the market. If the VIX can hold off long enough to start tracing the lower band line lower - as opposed to bouncing off of it - then the market's rally may be allowed to get some traction. However, with the VIX being back near unheard of lows, the market still looks vulnerable.
By the way, the bulls can also make the case for the break above resistance at 1290...if we close under that mark. If we stay here for the day, it will be the highest close in three months. Inspired bulls may be able to shrug off the vulnerability and send stocks higher against the odds.
S&P 500 Chart

Things to Consider
On a side note, don't forget that periods of high volatility are followed by periods of low volatility As of right now, the market is due for a transition into a volatile period. Since May, none of the indices have really gone anywhere. The sideways churn has given all the moving averages of all timeframes a chance to 'catch up' with one another. As an example, notice how all the moving average lines for the S&P 500 are within 17 points (1.3%) of one another. Yes we're ripe for bigger movement, just to get the moving average diverging again. In no way does this tell us which direction we're headed, but it does suggest a big, efficient move.
Price Headley is the founder and chief analyst of BigTrends.com.