NASDAQ Commentary
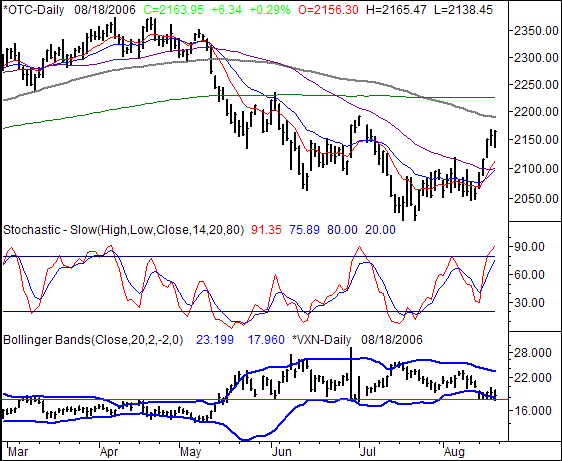
The NASDAQ Composite gained 6.34 points (+0.29%) on Friday to end the week at 2163.95. That's 106.24 points (5.16%) better than the prior Friday's close, and also happens to be one of the biggest weekly gains we've seen in months. Yet, despite the gain, we can see the momentum already waning as the index becomes about as overbought as it has been since May, and you know what kind of bearishness that set up.
The Bearish Case
Yes, the trend is your friend. We know that. However, the 'trend' has been pretty unfriendly all year long, reversing course right as everybody got on board. The fact that the gains were almost heroic this past week makes the danger that much greater - for several reasons.
First, note the stochastic lines. We're just about as overbought as we were in June, right before the NASDAQ rolled over and fell from 2190 to 2012. While it's more than possible for any market to end up staying overbought, it's not a habit the composite has been in of late. Plus, with all sorts of potential time-bombs out there (Bernanke, oil, Middle East, economy), it wouldn't take much bad news to do a lot of damage...the index is highly vulnerable, and traders aren't even going to think twice about selling now that there are some profits under their belt.
Second, we made a gap between 2115 and 2120 with Wednesday's bullish surge at the open. The market, though, hates to leave gaps. To clean this one up, it will need to fall more than 46 points...something that will not be well received by current stock owners. Like we said, the gap-closing move may only be a small dip in itself, but if it spooks investors, it could turn into a much bigger correction.
Thirdly (and finally), how is it that the CBOE NASDAQ Volatility Index (VXN) only falls a little more than 1.5 points during a week the composite gains 5.16%? It doesn't jive. Could it be a case of where investors are doing one thing but planning on another? No, not quite...the lack of fear (the VXN is back near rock-bottom lows) is consistent with the NASDAQ's strength. The problem is, there's just too much confidence and complacency. The current VXN reading of 18.45 is a multi-week low, and right where we saw the VXN bottom before July's big pullback. On a relative basis, the market just has a little (ok, a lot) more confidence than it should. A correction of that condition - with a pullback - is likely.
On the other hand, we've seen stranger things happen. We think the real test is going to be at the 10 and 20 day moving average, currently at 2113 and 2099 (respectively). If they actually hold as support, then the rally has a chance to continue. If they don't, we're looking for an even bigger stumble. Either way, we'll need to see the market slide a little before getting enough data to make the call.
NASDAQ Chart

S&P 500 Commentary
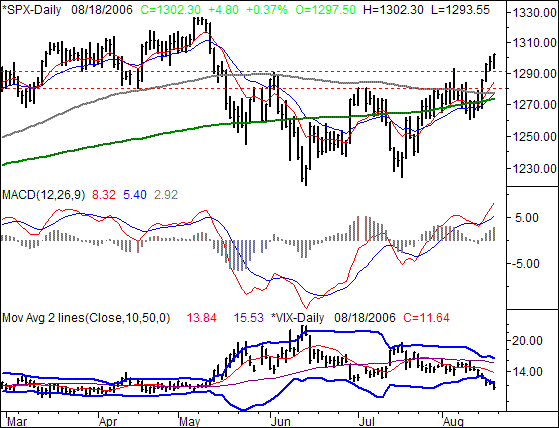
The S&P 500's 4.80 point gain (+0.7%) on Friday pushed the large-cap index up to a close 1302.30 for the week, which translates into a 35.55 point gain (+2.81%) over the previous week's close. That close was also above both of the key resistance lines (1280 & 1290) we'd been watching. Yet, we're still quite hesitant to get bullish here. The expectation is so bullish - according to the VIX - stocks can't possibly live up to the hype. Once they disappoint, and we see the all the chinks in the armor, this sharp rally may end up being just a set up for a big dip.
The Bullish Case
In terms of technical indications, the picture is pretty clear. We have a renewed MACD crossover, and the 10 and 20 day moving average lines are now both back above the 200 day moving average. The S&P 500 is also above both resistance key lines (1280 and 1290). On top of that, the CBOE S&P 500 Volatility Index (VIX) fell from 14.30 to 11.64 last week, making a handful of lower lows along the way. All of them are signs of a market moving higher.
The Bearish Case
The argument here, ironically, as about the same as the bullish case - stocks moved higher last week...that's the problem. The market has not been able to string together two really bullish weeks in months, opting to slide backwards each time a little upside progress was made. In fact, you can already see how the rate of gain is diminishing; each successive gain last week was a little weaker than the previous one. The degree of 'higher high' also shrank each day.
Plus, look at the VIX. It's just at an extreme low again. Although not quite to the persistently-low readings of just under 10 like we saw in the spring time, the current level is still oddly low. Whether it's on a short-term or intermediate-term basis, this much complacency is just very unlikely to go corrected.
That being said, as with the NASDAQ, you may want to see how the market reacts when the 10 day (and 20 day) line is retested as support. It's currently at 1285, while the 20 day line is at 1277. If the S&P 500 pulls back and starts to recover there, then the rally may actually stabilize and move forward. But, being as over-extended as we are right now, the pressure may just be too great. If the SPX slips under the 200 day line again (currently at 1273), it will probably spook the market into even heavier losses. Watch closely.
S&P 500 Chart

Dow Jones Industrial Average Commentary
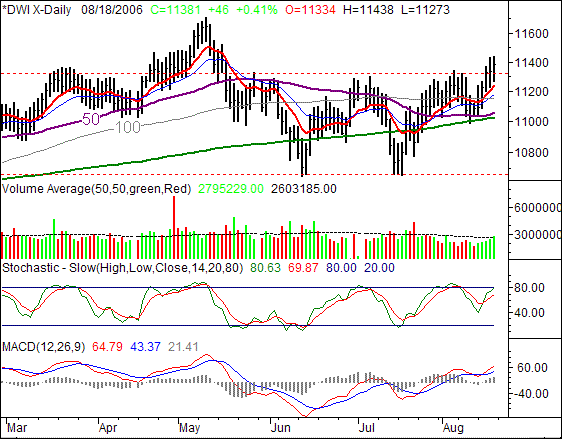
The Dow led the way on Friday, topping all other indices with a 0.41% gain (up 46 points) to close at 11,381. For the week, the blue-chip index gained 2.64%, or 293 points. And yes, the Dow's chart is an enigma too...moving higher is bullish, as is the break past resistance. However, the Dow hasn't been able to muster any real follow-through in months. Can this time really be any different?
The answer will likely be given this week. The Dow Jones Industrial Average isn't as overbought as the other indices are, so any dip wouldn't be quite as dramatic. Plus, the Dow has a much better shot at finding support, with all of its moving average lines pointed higher, and with most of them in the wake of bullish crossovers. Just keep in mind we've seen that happen before...and it didn't mean anything particular bullish then. Let's just see if the Dow can make any progress this week. If it can, we'll then be believers. If not, a dip back to the 10,660 is a real possibility.
Dow Jones Industrial Average Chart

Price Headley is the founder and chief analyst of BigTrends.com.