NASDAQ COMMENTARY
It looks like we finally might be getting an answer to the question "How far can the NASDAQ go?" As of right now, the answer is 2062 (and change). That's where the composite topped out Monday as well as Tuesday; the bulls aren't making a third attempt. Instead, the bulls are taking a breather, and rightfully so. The past three weeks have been one of the best three week periods in years, so a little profit-taking is well-deserved. And in the grand scheme of things, we'd rather see this adjustment made early on in the new trend, rather than later....when it could really hurt.
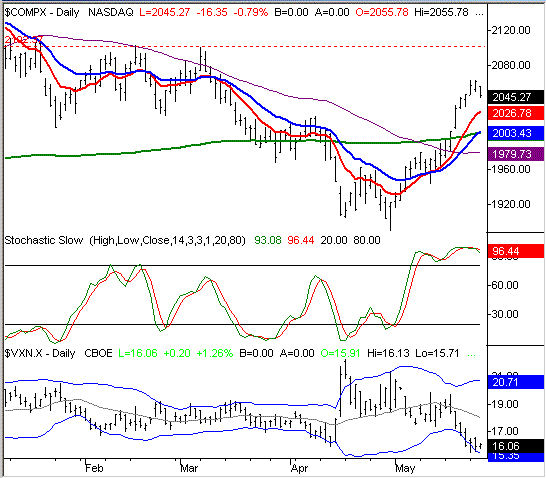
Today's pullback all boils down to one thing - being overbought. Investors got a little euphoric in May as stocks went like gangbusters. The market has a way of balancing things out though, and that's what's happening now. This idea can be put into technical terms as well. Just take a look at the stochastics portion of our chart. We've been overbought (above 80) since May 9th. Generally speaking, it's possible, and even normal, to stay overbought for extended periods of time. So, that in itself is not a reason to bail out. But when considering just how reversal prone we've been this year, the odds favor(ed) a pullback rather than a continuation.
We also saw a bearish setup in our moving average lines. More specifically, the bearish setup was in the degree of separation between the moving averages and the NASDAQ's price bars. On the 18th, the composite blew past its 200 day line, and hasn't even stopped to take a break until today. As of yesterday's close, the NASDAQ was 3.0% above the 200 day average (green), and 1.9% above its 10 day average (red). The variance with the 200 day line is within the norm, but it's extremely unusual to see an index that far away from its 10 day line. For evidence of that, just look back over the last few months. The only two times the NASDAQ got that far away from its 10 day average soon resulted in a sharp reversal to reel it back in (Jan 25th, and April 18th). Not liking that much imbalance, the market took care of the problem again.
The question then becomes, what's next? As we say in late January and mid-April, it takes more than one day to correct the problem. In fact, each of those correction lasted several days, and the NASDAQ actually was hurled back across the 10 day line - in the other direction, of course. With the 10 day average currently at 2026.50 and the composite currently trading at 2043.5, a cross back under the 10 day line is more than plausible....it would only be about a 1 percent dip. That, however, might not be enough to shed all this excess bullishness. Realistically, we think the NASDAQ will come all the way back to the 2000 area. The 200 day line and the 20 day line are both right there (augmenting each other's support strength). Plus, the 2000 level continues to be a strong psychological support line. Such a dip would be about a 4 percent drop, which should adequately keep the bulls in check without giving the bears undue confidence.
Once all that's done, we still anticipate a resumption of this bullish trend. The NASDAQ has emerged as a leader on the long-term charts, which typically precedes a bullish move. Throw in the fact that all of the key moving averages are again pointed higher, and the overall upside momentum is clear.
The next resistance level is 2100.
NASDAQ COMPOSITE CHART

S&P 500 COMMENTARY
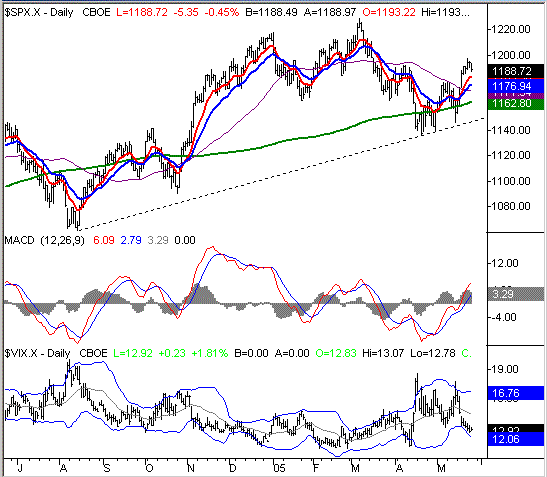
We've really zoomed out on our S&P 500 chart, as we want to make sure everything about this pullback is kept in perspective.
The same basic ideas that apply to the NASDAQ also apply here; stocks were overbought, and now that problem is being solved. There are a few minor differences though. First, the SPX's divergence from the 10 day line wasn't quite as strong as the NASDAQ's. So, the degree of reversal shouldn't be quite as strong as the NASDAQ's either. As of yesterday's close, the S&P was only 1 percent above the 10 day average, and half of that difference has been closed today. The S&P is currently at 1188....just 11 points above the 10 day average. But also like the NASDAQ, the 10 day average isn't the most likely bounce point for this large-cap index. Rather, we see the support for this dip coming somewhere between the 20 and 50 day lines, or between 1172 and 1177. Pulling back all the way to those levels would represent about a 2 percent tumble from the SPX's recent high of 1197.44 - a tumble actually big enough shake-out any lingering momentum, and clean the slate so to speak.
But what we really wanted to focus on here was what's most likely to occur after this small correction is completed. Even if the S&P 500 does fall all the way back to 1172, it will still be above the 50 day line, and more importantly, above the 200 day line (green). It's also worth mentioning that the 200 day average is still pointed higher, so the long-term bull trend has been intact since November, despite this year's rough start. The most important piece of the chart, though, is the long-term support line (dashed) that actually goes all the way back to September of last year. That support line wasn't clear until we hit this year's low, but now that we've seen it, we have a benchmark. As long as we can stay on top of that line, the bigger trend will be bullish.
In the meantime, look for a little more selling over the course of the next few days. Once it's over, the next resistance point is the most recent 52-week high of 1229.
S&P 500 CHART

SPECIAL COMMENTARY - READER QUESTIONS
QUESTION: It seems to me that many stocks form gaps at one time or another. And that many times the gaps get filled in a fairly short time, however some of the gaps do not get filled for months or even years. On the other hand, it appears to me that when an index forms a gap, it usually fills or tests in short order. I have been watching several different indices and it seems that it is a certainty that the gaps get filled and this happens sometimes on a daily basis and usually within a few weeks at most. I am just wondering if there is any supporting data for this phenomenon. Is there any data available to that would support this conclusion?
ANSWER: There's no empirical evidence or verifiable statistics on this idea that we know of. But, based on our observations, you are correct - most index gaps do get filled quickly, while many (but not all) stock gaps don't always get filled right away....or at all if it's a bullish gap. So yes, this does present a short-term trade opportunity. I don't know that I would make it your only technique though. You may want to look at some of the traditional Japanese candlestick theories to also apply to the gap theory......this
works especially well for the indexes.
BOTTOM LINE
One of the things we didn't discuss in either chart analysis but included on both charts was the CBOE Volatility Indices. For the NASDAQ we used the VXN, and for the S&P 500 we used the VIX. Without getting into the entire philosophy, both of them hit lows yesterday at or under the lower Bollinger bands, and both are making reversal patterns today. That's why we've been anticipating at least a brief pullback for a few days....now it's coming to fruition. Now that both of them seem to have hot an extreme low, the buyers appear to be giving up for a while. This market weakness will end about the same time both the VIX and the VXN find a resistance level.
Price Headley is the founder and chief analyst of BigTrends.com