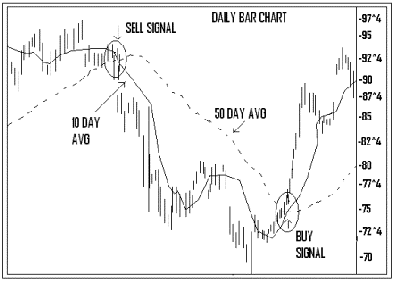
The technique of using two moving averages is called the double crossover method. Two of the more popular combinations are the 5- and 20-day averages and the 10- and 50-day averages. The double crossover means that a buy signal is produced when the short average crosses the long one. In the 5- and 20-day averages, a buy signal occurs when the 5-day average crosses above the 20, and a sell signal is recognized when the 5-days moves below the 20. When the 10-day crosses above the 50, it signals an uptrend. When the 10-day slips below the 50, a downtrend takes place. Using two averages together lags the market more so than just a single average, but it produces few whipsaws. The rough example below shows the use of 10-day and 50-day averages. Note the markings for the sell and buy signals.

The use of three averages is called the triple crossover method. The most commonly used is the 4-9-18-day moving average combination. The 4-9-18 is used primarily in futures trading , and is a variation of the 5-, 10-, and 20-day averages widely used in commodities. Many commercial chart services publish the 4-9-18- day combination, and many charting software programs use this combination as their default when plotting three averages.
In the 4-9-18-day moving average combination, the 4-day average follows the price trend the closest, followed by the 9-day, then the 18-day. So in using the combination in an uptrend, the proper placement would be for the 4-day to be above the 9-day, which is above the 18 day average. In a downtrend, the order is in reverse. The 4-day would be the lowest, the 9-day above that, and the 18-day above both the 4 and 9.
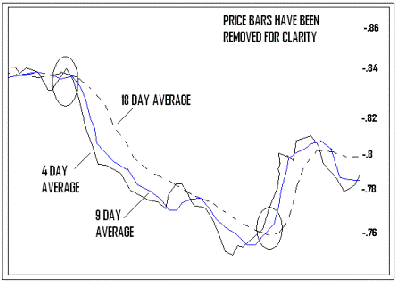
Let's take a look at using this combination in a downtrend. A buying alert takes place when the 4-day crosses both the 9- and 18-day averages. The buy signal is confirmed when the 9-day also crosses above the 18-day. So now looking at the chart the 4-day is above the 9-day, and the 9-day is above the 18-day. Some intermingling will occur during corrections and consolidations, but the uptrend will generally remain intact. Some traders like to take profits during the intermingling, and others like to use it as an opportunity to buy. This method offers a lot of room for flexibility in applying the rules depending on the traders aggressiveness. Take a look at the rough graph below for an example. The prices bars have been removed to make it easier to see the averages.

When the uptrend reverses to the downside, the first thing that should happen is for the 4-day, the shortest and most sensitive line, to dip below the 9-day and the 18-day creating a selling alert. This point will trigger some traders to begin liquidating their long positions. A confirmed sell short signals occurs only if the 9-day also drops below the 18-day.
Andy Swan is co-founder and head trader for DaytradeTeam.com. To get all of Andy's day trading, swing trading, and options trading alerts in real time, subscribe to a one-week, all-inclusive trial membership to DaytradeTeam by clicking here.