NASDAQ Commentary
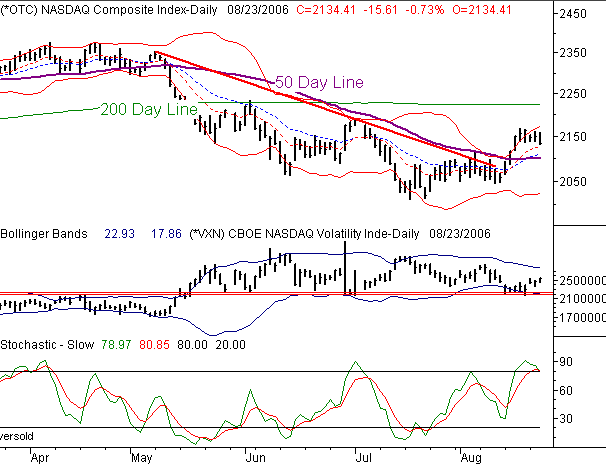
The NASDAQ broke through the upper Bollinger Band last week and things were looking somewhat bullish. It turns out that this move outside of the bands is putting some pressure on the NASDAQ. In addition to the bands, the NASDAQ is right at short-term high, which usually suggests a high probability of a short-term correction. Not only that, stochastics slow is showing overbought conditions as well. Unlike the SPX, the NASDAQ still sits below the 200-day line and has not seen the surface since mid-May.
Last week, we clued you in about the VXN's apparent skepticism regarding the recent rally. Specifically, the VXN was not dropping the way it usually does during a rally and it made us cautious about the NASDAQ rally. The last few days has shown little change in the VXN and moderate bearish resistance in the NASDAQ. When combined with our sentiment indicators, this information gives us a bearish bias on the OTC. Because if you are trading NASDAQ stocks in the coming week.
As far as this week goes, the NASDAQ is currently down 0.67% for today and 1.3% for the week. Watch for resistance again at the upper Bollinger Band.
NASDAQ Chart

S&P 500 Commentary
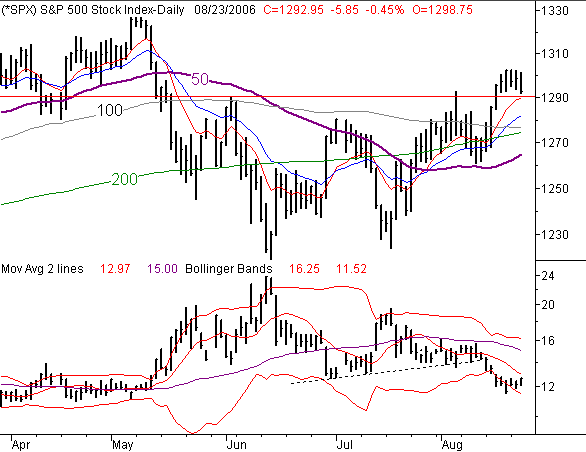
The S&P 500 is down 6.31 points today (-0.49%). For the week, the current trading level of 1292 is 0.76% lower than Friday's close.
One key development in the past few days was the VIX's drop below the lower band for 3 consecutive days. We actually haven't seen that happen in years. Our first reaction was to view this bearishly. We still view it as such and as you can see in the chart, the day's ranges for the SPX have narrowed since we saw 2 surging days last week. It looks like the market is hitting resistance and it's likely that there is little upside to the market at this point in the short-term.
As far as market sentiment goes, the Rydex ratio sits right at the upper Bollinger band and is actually bullish because the ratio has not reversed since meeting the upper band. It looks like institutions are betting that the upward move in the market will continue. Although there are many bullish signs in the market, this one conflicts and it's coming from the institutional players so, we should watch out.
All this being said, the downside is larger than the upside just as in the NASDAQ, so take caution if you are buying calls or going long on stocks.
S&P 500 Chart

Dow Jones Industrial Average Commentary
The Dow is down 0.76% for the week and 0.40% for the day. Just like SPX, the Dow is above virtually every major moving average. The Dow also continues to outpace the SPX and the NASDAQ YTD. We expect the Dow to continue is defensiveness as the Dow has been benefiting from its commodities-oriented components such as XOM. On the other hand, the DOW is giving us very little clues as to where the overall market is heading and has not proven to be a leading indicator this year. It's the NASDAQ that we should be watching closely this week . Bear in mind that he NASDAQ dropped significantly right before the big market drop in May.
Dow Jones Industrial Average Chart

Price Headley is the founder and chief analyst of BigTrends.com.