The market has struggled this week, and that has certainly caused some consternation for the bulls who were so excited by last week's strong rally. It appears that last week's rally was more aided by option expiration than many thought. We say that because -- in the week following a strong expiration-aided rally -- the market usually sells off and has trouble following through, which is exactly what has happened. However, that expiration effect has worn off by now, so we can turn our attention to the technical indicators for guidance. In general, they are positive, with one major exception -- volatility.
$SPX broke out over the 1280-1290 area last week, and that area should and is providing support this week. The last two days, $SPX has bottomed near 1290. The graph of $SPX is shown in Figure 1. Note that we have outlined the trendlines that held the rally together early this year. Has another such trend started? If so, that trend line also is currently at about 1280 -- making a further case for that level to be support. So, unless proven otherwise, speculators can buy on dips into the 1280-1290 area.

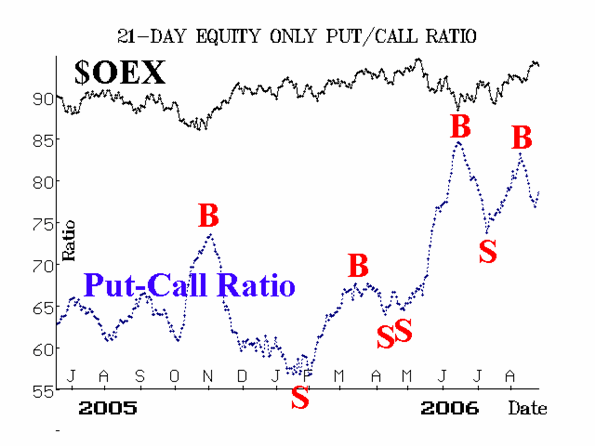
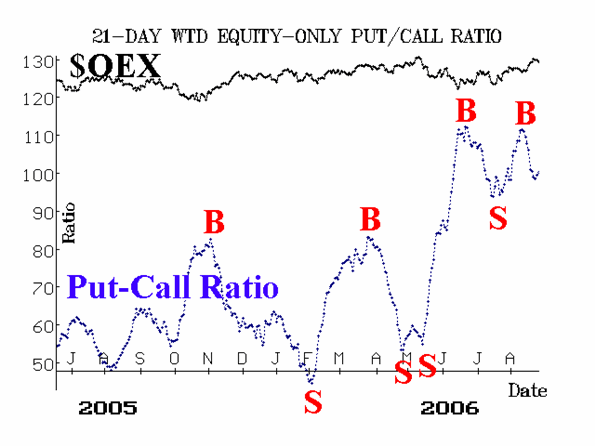
The equity-only put-call ratios gave timely buy signals about two weeks ago, and they remain on them at this time (despite the little "hooks" that showed up after Wednesday's trading -- when the single-day put-call ratio ballooned to 92). We still don't understand (and may never understand) why the put-call ratios rose during the last half of July, when the market was also rising. But they seem to be back in synch now. Even the NASD ratio has given a buy signal (rightmost chart above) as has the QQQQ weighted ratio.

Market breadth has been weak all year. When last week's rally unfolded, breadth was strong and both breadth oscillators reached overbought status. However, this week, breadth has faltered and the "stocks only" oscillator has generated a sell signal, while the NYSE-based oscillator is flirting with a sell signal. Breadth just hasn't been that great all year.

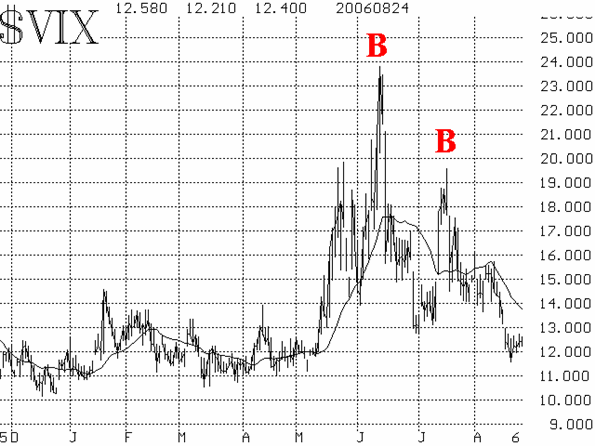
Finally, we come to the major problem area -- something that is a theme for the remainder of this newsletter: volatility is dangerously low. When last week's rally finally concluded, $VIX had fallen to 11.50. That's a very complacent attitude amongst index put sellers (they are the ones who dictate much of what makes up the $VIX calculation). Now, we know that the market can rally while $VIX remains low, and in fact the market can rally while $VIX increases (although it hasn't done that to any substantial degree for about ten years). Hence, we wouldn't pull the plug on any long positions yet, merely because of these low volatility index readings, but it's certainly a sign to remain on alert -- to adhere to stops in your trading positions from the long side.

In summary, we see that $SPX and the equity-only put-call ratios are bullish. Breadth is giving what amounts to minor sell signals. Finally, $VIX is reflecting a great deal of complacency. The market can rally for a while when traders are complacent, so the entire picture adds up to a slightly bullish one in our opinion.
Lawrence G. McMillan is the author of two best selling books on options, including Options as a Strategic Investment, recognized as essential resources for any serious option trader's library.