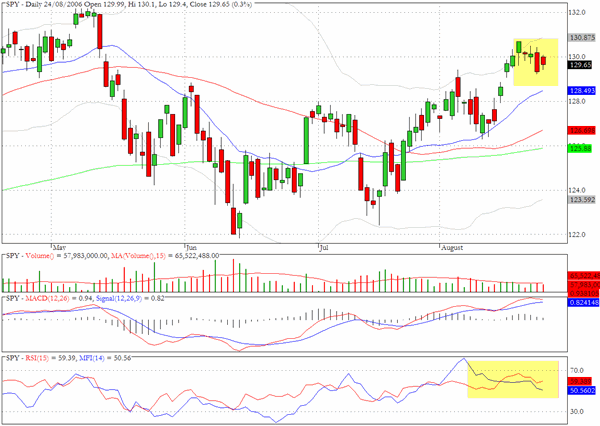
We normally feature the S&P 500 cash index (^SPC) chart in this spot, which yesterday revealed an inside day green candlestick with a close at 1296. However, the SPY chart below reveals an inside day but with a red candlestick showing that the close was below the open. The two instruments obviously trade very closely, but from time to time there are small discrepancies. We noted earlier in the week that the very tiny Doji candlestick that is also present on the SPY chart failed to make a similar appearance on the chart for the cash index.
The discrepancies may be due to the somewhat reduced liquidity at present but are perhaps also symptomatic of the fact that the 1300 level is presenting itself as a key threshold for the market to contend with.
I will be observing the long holiday weekend in the UK and will re-appear on Tuesday morning.
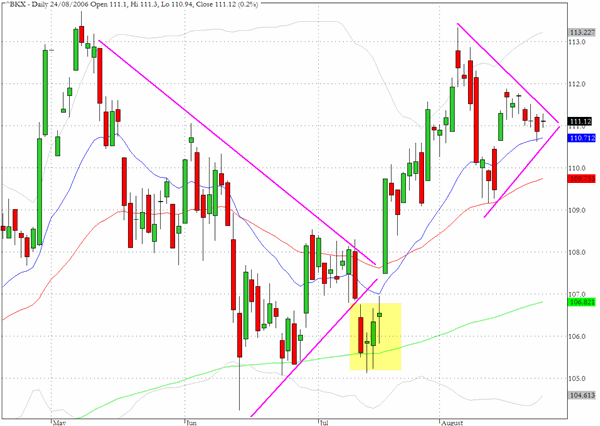
The formations on the banking index (^BKX) that we have drawn show how the index is getting poised for another break out in the near future. On the last breakout, as we have highlighted, there was a temporary false breakdown move but this was soon followed by the resumption of a bullish tone as the index attempted to regain the highs from early May. We will be watching again for the possibility of another false breakout move before the more enduring direction becomes clear.
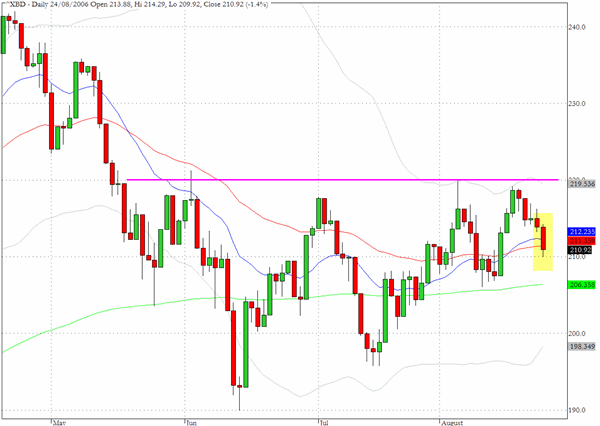
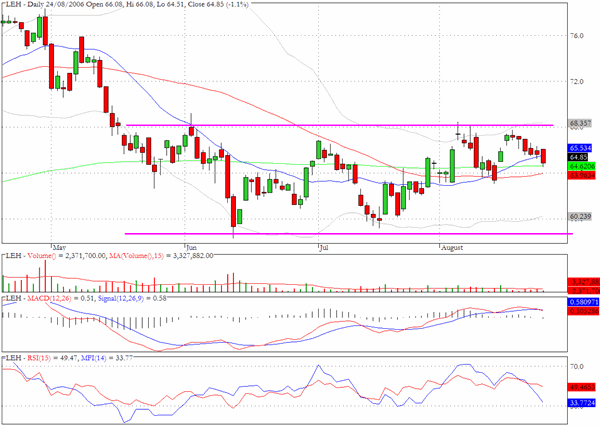
The broker/dealer sector (^XBD) has been unable to close above the 220 level since the sell-off for the sector that began in late April (predating the broader market sell off by several days). Yesterday the sector index closed marginally below the 50 day EMA in an ongoing sideways pattern that has persisted for more than three months.
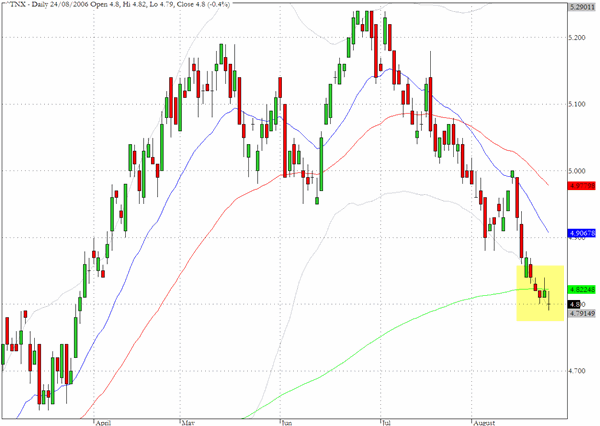
The yield on the ten year Treasury note has been steadily declining for several weeks and yesterday touched 4.8%. The chart formation suggests that we have probably reached a near term turning point in yields. However if we were to see a further sustained decline from here this would be sending a clear message that bond traders are expecting the economy to show more visible signs of weakness as 2007 approaches.
TRADE OPPORTUNITIES/SETUPS FOR FRIDAY AUGUST 25, 2006
The patterns identified below should be considered as indicative of eventual price direction in forthcoming trading sessions. None of these setups should be seen as specifically opportune for the current trading session.
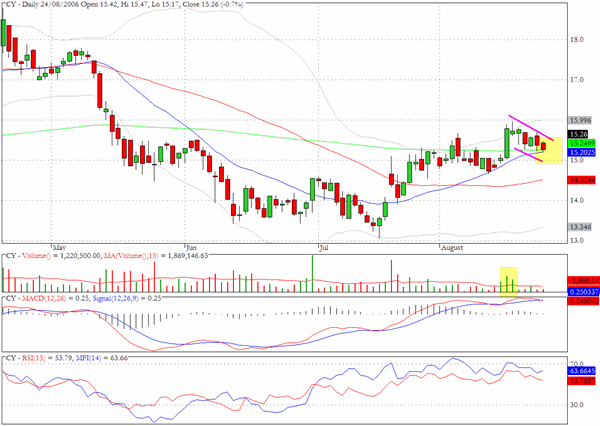
Cypress Semiconductor (CY) has a bullish flag formation and closed yesterday at the intersection of the 200 and 20 day EMA's
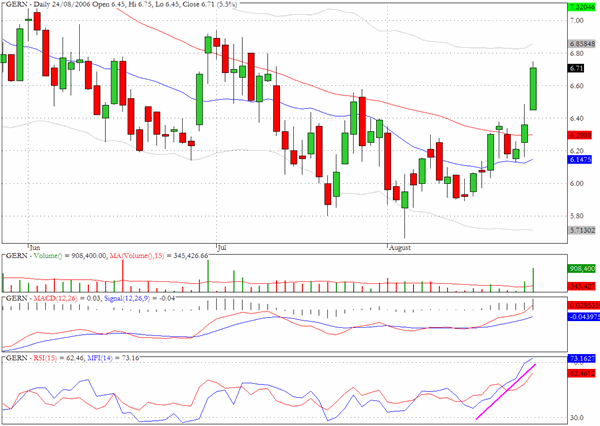
We missed a nice setup yesterday for GERN which has the MFI characteristics that often accompany a sharp upward move.
The pattern for Lehman Brothers (LEH) is exactly in accordance with the sideways pattern that we noted above for the broker/dealer sector. The 200 day EMA (green line) runs through the mid point of the narrow channel that has been in effect for more than three months.
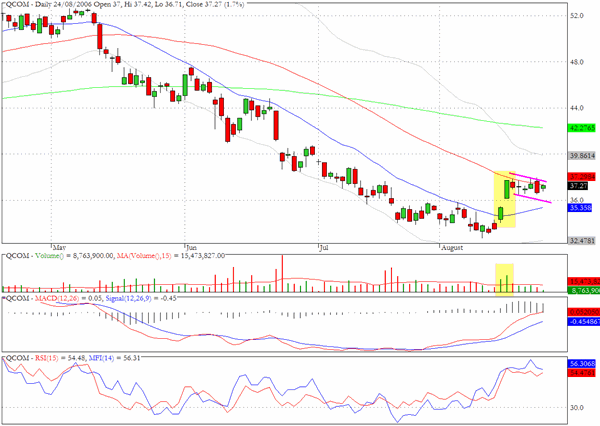
Qualcomm (QCOM) could be getting ready to extend its recent breakout rally.
Clive Corcoran is the publisher of TradeWithForm.com, which provides daily analysis and commentary on the US stock market. He specializes in market neutral investing and and is currently working on a book about the benefits of trading with long/short strategies, which is scheduled for publication later this year.
Disclaimer
The purpose of this article is to offer you the chance to review the trading methodology, risk reduction strategies and portfolio construction techniques described at tradewithform.com. There is no guarantee that the trading strategies advocated will be profitable. Moreover, there is a risk that following these strategies will lead to loss of capital. Past results are no guarante of future results. Trading stocks and CFD's can yield large rewards, but also has large potential risks. Trading with leverage can be especially risky. You should be fully aware of the risks of trading in the capital markets. You are strongly advised not to trade with capital.