If the market is up, be long. If it's down, be short. This is an oversimplification that demonstrates a truismâ€"momentum works. Entire trading careers have been built on it, not to mention most mechanical systems.
A simple way to gauge momentum, as we've discussed in the last couple articles, is heed the direction a market is from its opening. If it's spending most of the day above it, obviously there is more buying pressure and vice versa. Pit traders will also acknowledge thisâ€"a standard practice is to hold a position early in the day using the far side of the opening range as a stop. (This is one of several refutations of the random walk theoryâ€"a purely random market could not open at or so near to its ultimate daily high or low as often as it does on pure chance alone.)
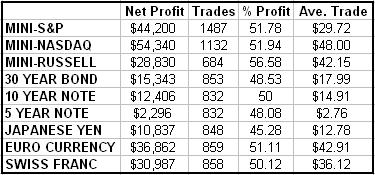
Today's demonstration of the phenomenon is the following: the average of the last three daily open-to-highs added to the daily opening is a buy stop entry. The average three daily open-to-lows subtracted from the open is a sell stop entry. Exit on the close. This is tested on 15 minute bars. The only other qualifier is you can't make a trade in the first half hour of the day. If the first two brackets trade through the price and persist into an allowed time frame, you enter at the market. (We don't want it to happen immediately, which takes away some of the false moves that government reports, etc. precipitate.)
We're basically saying, the last few days have seen an average move of X from the open to the high or the open to the low. As we hit the extreme average up or down level, we're betting that there's more to go in that direction until the close. As Figure 1 reveals, it's a good bet. You get a decent bias across all the financial markets we track.

The Biases for May 26
Daily down signals negate the monthly up bias in both the mini S&Ps and Nasdaq. Reverse from long to short in those markets. Hold existing longs in the Russell.
The bottom two rows determine the signal. Dynamic Day One trumps everythingâ€"you always follow it. When it's neutral, the Monthly Perpetual provides the direction. Click here for a more in-depth explanation of the rules.

DISCLAIMER: It should not be assumed that the methods, techniques, or indicators presented on in this column will be profitable or that they will not result in losses. Past results are not necessarily indicative of future results. Examples presented on this column are for educational purposes only. These set-ups are not solicitations of any order to buy or sell. The author, Tiger Shark Publishing LLC, and all affiliates assume no responsibility for your trading results. There is a high degree of risk in trading.
Art Collins is the author of Market Beaters, a collection of interviews with renowned mechanical traders. He is currently working on a second volume. E-mail Art at artcollins@ameritech.net.