NASDAQ Commentary
The NASDAQ Composite lost 3.18 points (.15%) on Friday to end the week at 2140.29. That's 23 points (1%) lower than the prior Friday's close.
The NASDAQ hit the brakes big time this week as you can see in the chart, the NASDAQ continues to hit resistance at short-term highs and has done this in early June, July, and now again in late August.
The stochastics lines are still around those overbought marks and this week showed that the stochastics provided a good warning of eventual choppiness and bearishness. Specifically, there was a bearish crossover of the K and D lines right in overbought territory, which is usually a bearish sign. The NASDAQ is still below the 200-day line and that means that conditions are mostly bearish. Most of the time the NASDAQ and the market as a whole tends to have lots of failed rallies while under the 200-day line and this trip under the 200-day line is no different.
If you look at the VXN right below the NASDAQ, you will clearly see that there was resistance at the bottom band and this points to the downside more in the market than the upside. Last week's extremely low readings were a warning sign that the market was overconfident and perhaps greed was at excessively strong levels. As most of us know, this is usually a sign of bearishness to come.
NASDAQ Chart

S&P 500 Commentary
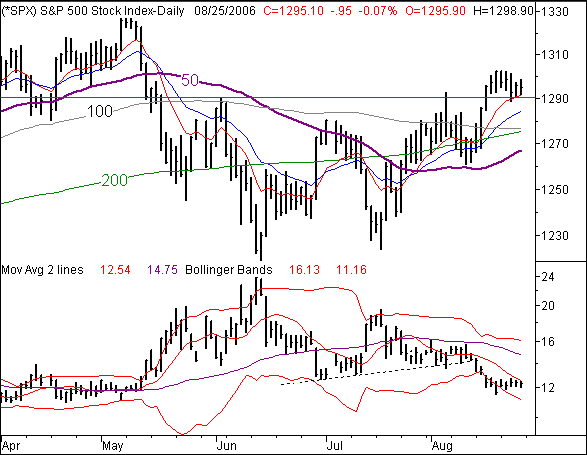
The S&P 500's .97 point loss (-.07%) on Friday dropped the large-cap index down to 1295 a close for the week, which is a 7 point loss (-.50%) over the previous week's close. That close was also above both of the key resistance lines (1280 & 1290) we've been watching.
The Bullish Case for the SPX is much stronger than for the NASDAQ because the SPX has just performed better than the NASDAQ and there is no sign that this will change soon.
For the bearish factors, our suspicions last week were confirmed this week, and that's not changed a great deal. The daily ranges for the SPX have narrowed after the large rally and that's not changing a great deal.
The argument here, ironically, as about the same as the bullish case - stocks moved higher last week...that's the problem. The market has not been able to string together two really bullish weeks in months, opting to slide backwards each time a little upside progress was made. In fact, you can already see how the rate of gain is diminishing; each successive gain last week was a little weaker than the previous one. The degree of 'higher high' also shrank each day.
Plus, look at the VIX. It's just meandering at this point. Although not quite to the persistently-low readings of just under 10 like we saw in the spring time, the current level is still oddly low.
That being said, as with the NASDAQ, you may want to see how the market reacts when the 10 day (and 20 day) line is retested as support. It's currently at 1285, while the 20 day line is at 1277. If the S&P 500 pulls back and starts to recover there, then the rally may actually stabilize and move forward. But, being as over-extended as we are right now, the pressure may just be too great. If the SPX slips under the 200 day line again (currently at 1273), it will probably spook the market into even heavier losses. Watch closely.
S&P 500 Chart

Dow Jones Industrial Average Commentary
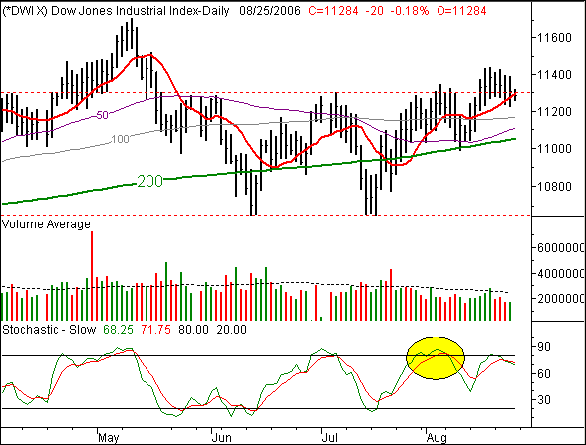
The Dow dropped .18% (20.41 points) to close at 11284.05 . For the week, the blue-chip index dropped 0.85% , or 97 points.
The Dow managed to move sideways the whole week. The blue chips got some decent support and like the other indices, we're not seeing any follow-up from last week's run-up. Let's keep an eye on the 11,300 area, where the Dow has met with some resistance the last couple of months. As far as the major moving averages go, they are serving well as lines of support for the Dow. Overall, the outlook on the DOW is more bullish than bearish unlike the other major indices.
Dow Jones Industrial Average Chart

Price Headley is the founder and chief analyst of BigTrends.com.