It has been a few weeks since my last update, and somewhere in between there I have taken my usual summer vacation, with my eyes and head purposefully away from the market. Once or twice a year, I make it a point to "get away" from any type of exposure to the market's motions, I wind down short-term positions and don't log-in to my accounts, or even avoid getting so much as a single quote for a week or so. I find this works very well for me. Just because the market is perpetually in motion, we as individuals don't have to be involved at every juncture. It's very good to have a mental "reboot" once in awhile - you come back with a fresh perspective.
For this week, let's do a simple multiple-time frame analysis and just focus purely on short-term aspects of the S&P 500, starting with the daily chart.

Chart Notations:
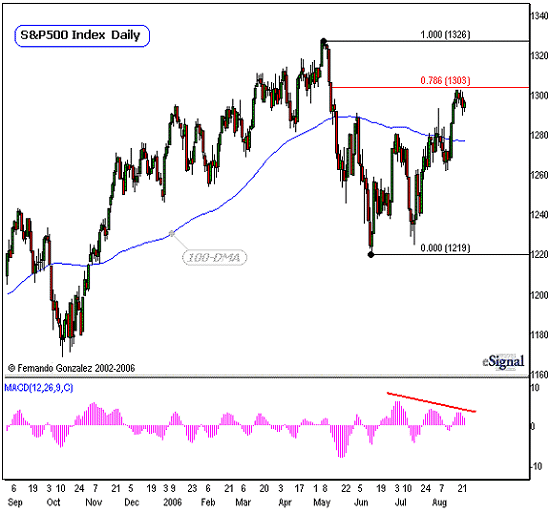
The daily chart of the S&P5 00 Index above addresses the short-term time horizon.
The largest, fastest and most violent move for 2006 is a downside Impulse that began in May. This took about a month before the S&P 500 bottomed, and another month to stabilize the powerful downside momentum.
By the second half of July, the market has entered into a recovery phase of the powerful decline. Some might say that this is already the continuation of a larger uptrend (on a larger time horizon), and they may very well be right. However, given the speed and magnitude of the decline in May, it is best that we first look at the recent rally as a "recovery attempt" rather than a full-blown resumption of a larger up-trend.
We note that the 100-DMA (blue) has turned and is downward in direction still - this helps us summarize the directional impulse of the dominant short-term trend.
Towards the bottom of the chart, we note that negative divergence in the MACD Histogram as well.
In concurrence to these facts, we therefore look at the recent rallies as "corrective" in nature, and treat it as such: that it is temporary, and the downward impulse that began in May is likely to be followed by another one of even greater magnitude at some point soon. So, let's take things step-by-step:
The .786 Fibonacci retracement is typically the S&P 500's "final frontier" of horizontal resistance during its corrective phases. This sits at the 1303 level and marked in red above. If the S&P500 were to give us a Daily close above the .786 mark, then perhaps we may shift our posture to look for higher targets, into new, multi-year highs in the upper 1300's zone.
Since we are still below this very important juncture, let us focus on downside targets, looking for resumption of downward impulses. Let's zoom-in to the hourlies.

Chart Notations:
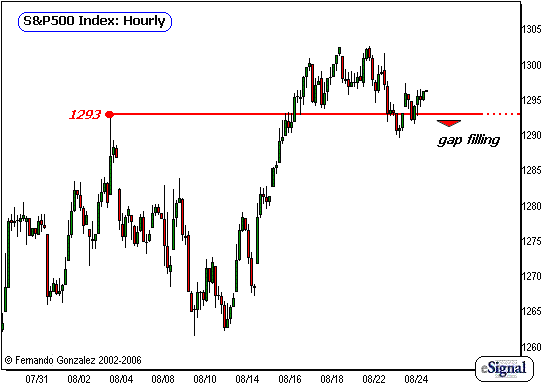
The intraday hourly chart of the S&P 500 above addresses the very short-term time horizon (10TD or less).
Last week, the S&P 500 broke to new swing highs by moving above the 1293 resistance mark. It has since moved back below as the market has reacted to a larger resistance point overhead (discussed in the previous chart).
There are gaps underneath the market that are left unfilled. We shall consider the gaps underneath the market as "out of play" so long as the S&P 500 is able to hold above the 1293 mark; and conversely, "in-play" if the market is able to once again move below. Let's zoom into the 30-min charts to see a little more detail.

Chart Notations:
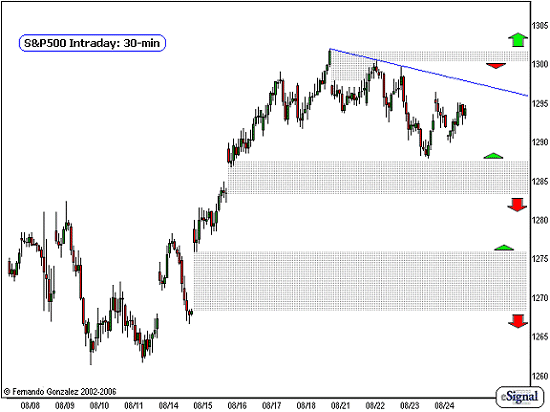
The Intraday 30-min chart of the S&P 500 above addresses the very short-term time horizon (10TD or less). With the help of the SPY charts, we are able to determine open gap levels for the S&P500 (gray area). Note that each open gap area is a neutral zone.
As previously planned, we only look for the market to begin filling the gaps underneath if it is able to trade below the 1293 level.
We also have a trendline in play (blue) for the very short-term. Sustained trade above the trendline puts the gap overhead into play. For now, as the market still trades below the trendline as well as the other evidence we have seen on the charts this week continues to favor an overall downward posture. Let's keep a close eye on these important technical marks for any changes.
Fernando Gonzalez is in his 10th year as an active trader, technical analyst and content contributor to the active trading community and a long list of popular financial media. Online Trading Academy trading knowledge...your most valuable form of capital.